K6 Monitoring, Troubleshooting and Reporting - Protocol and Browser
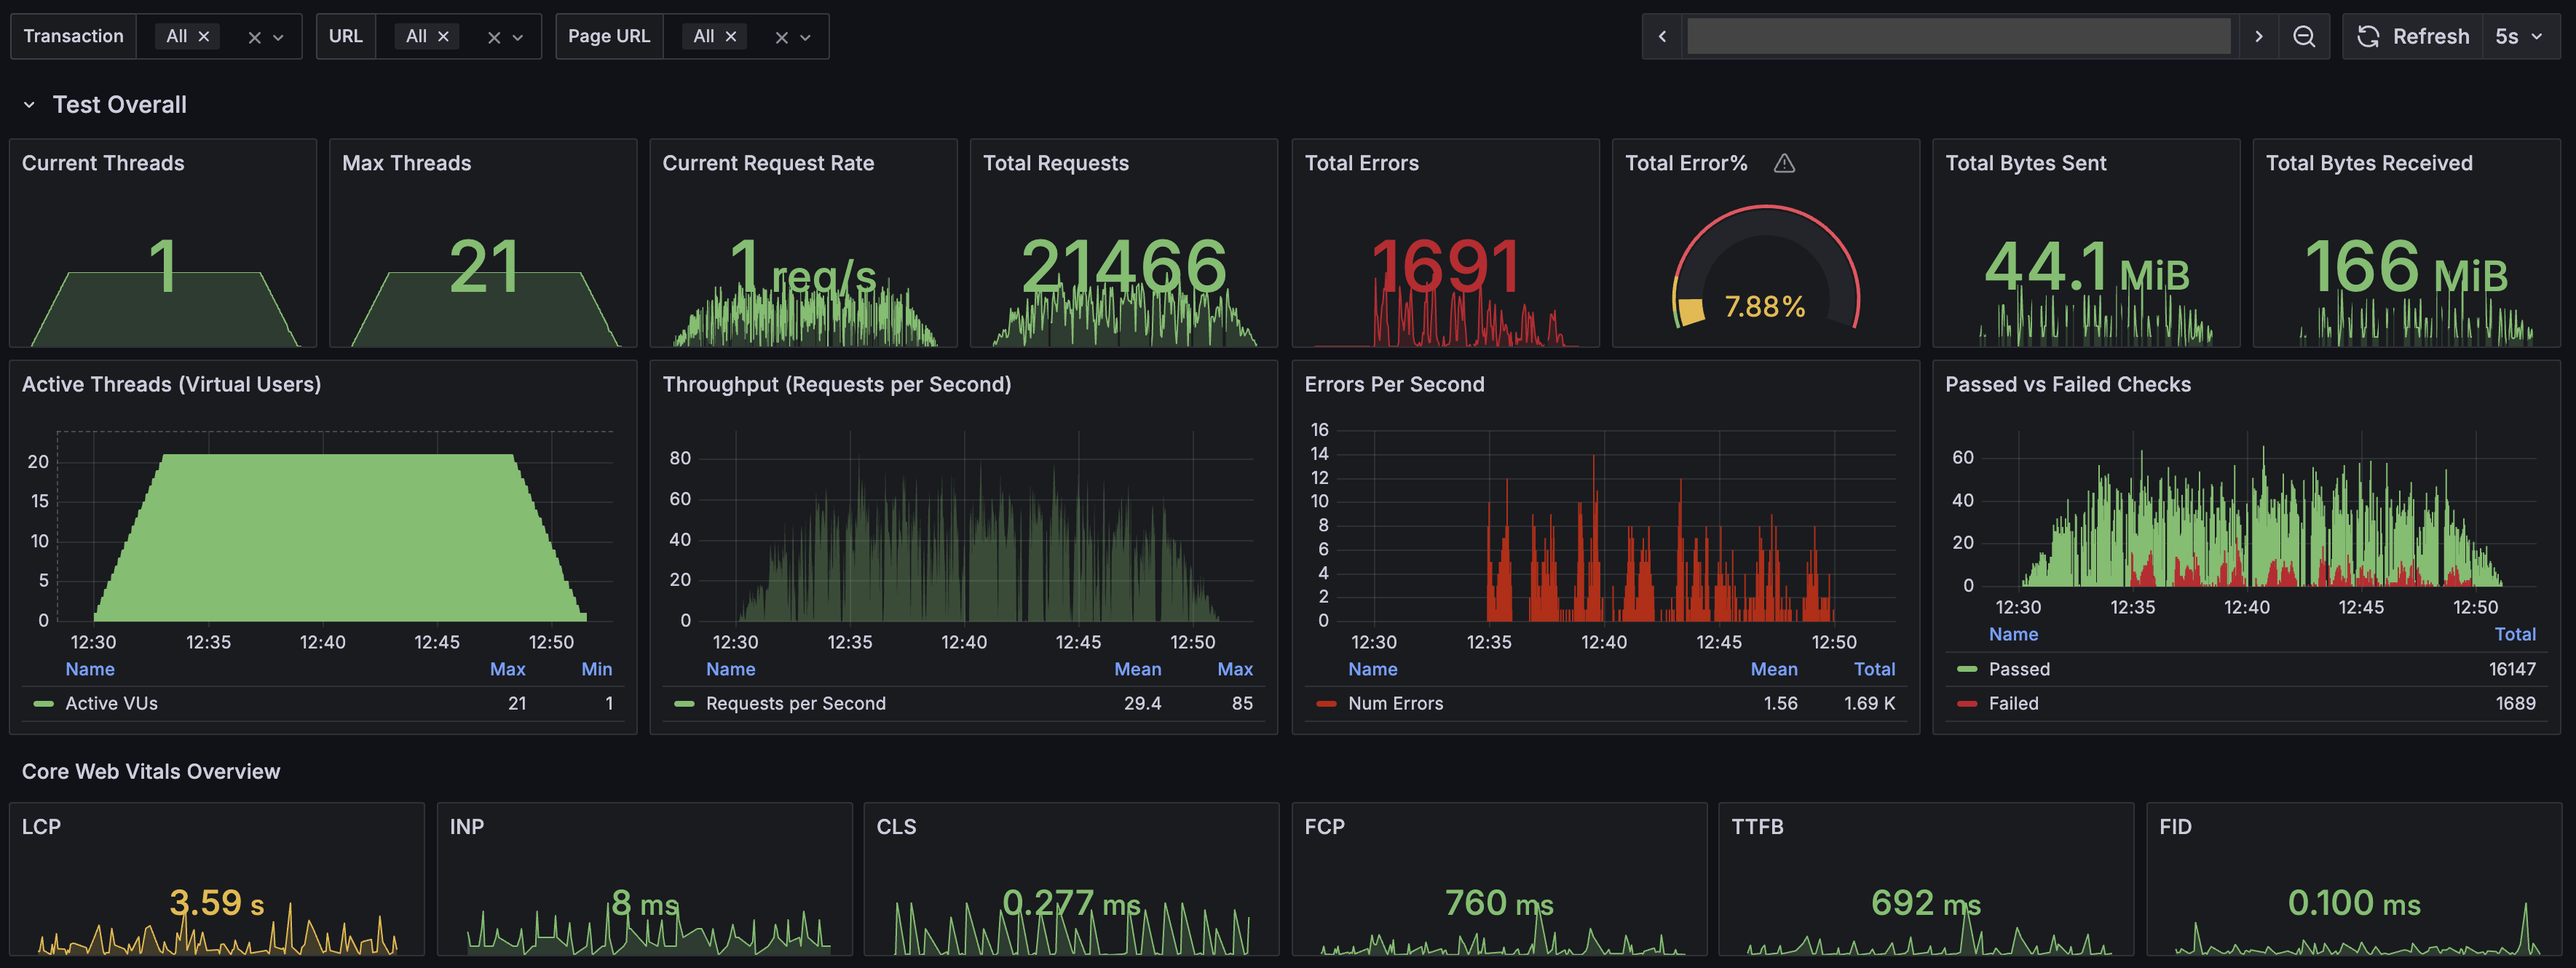
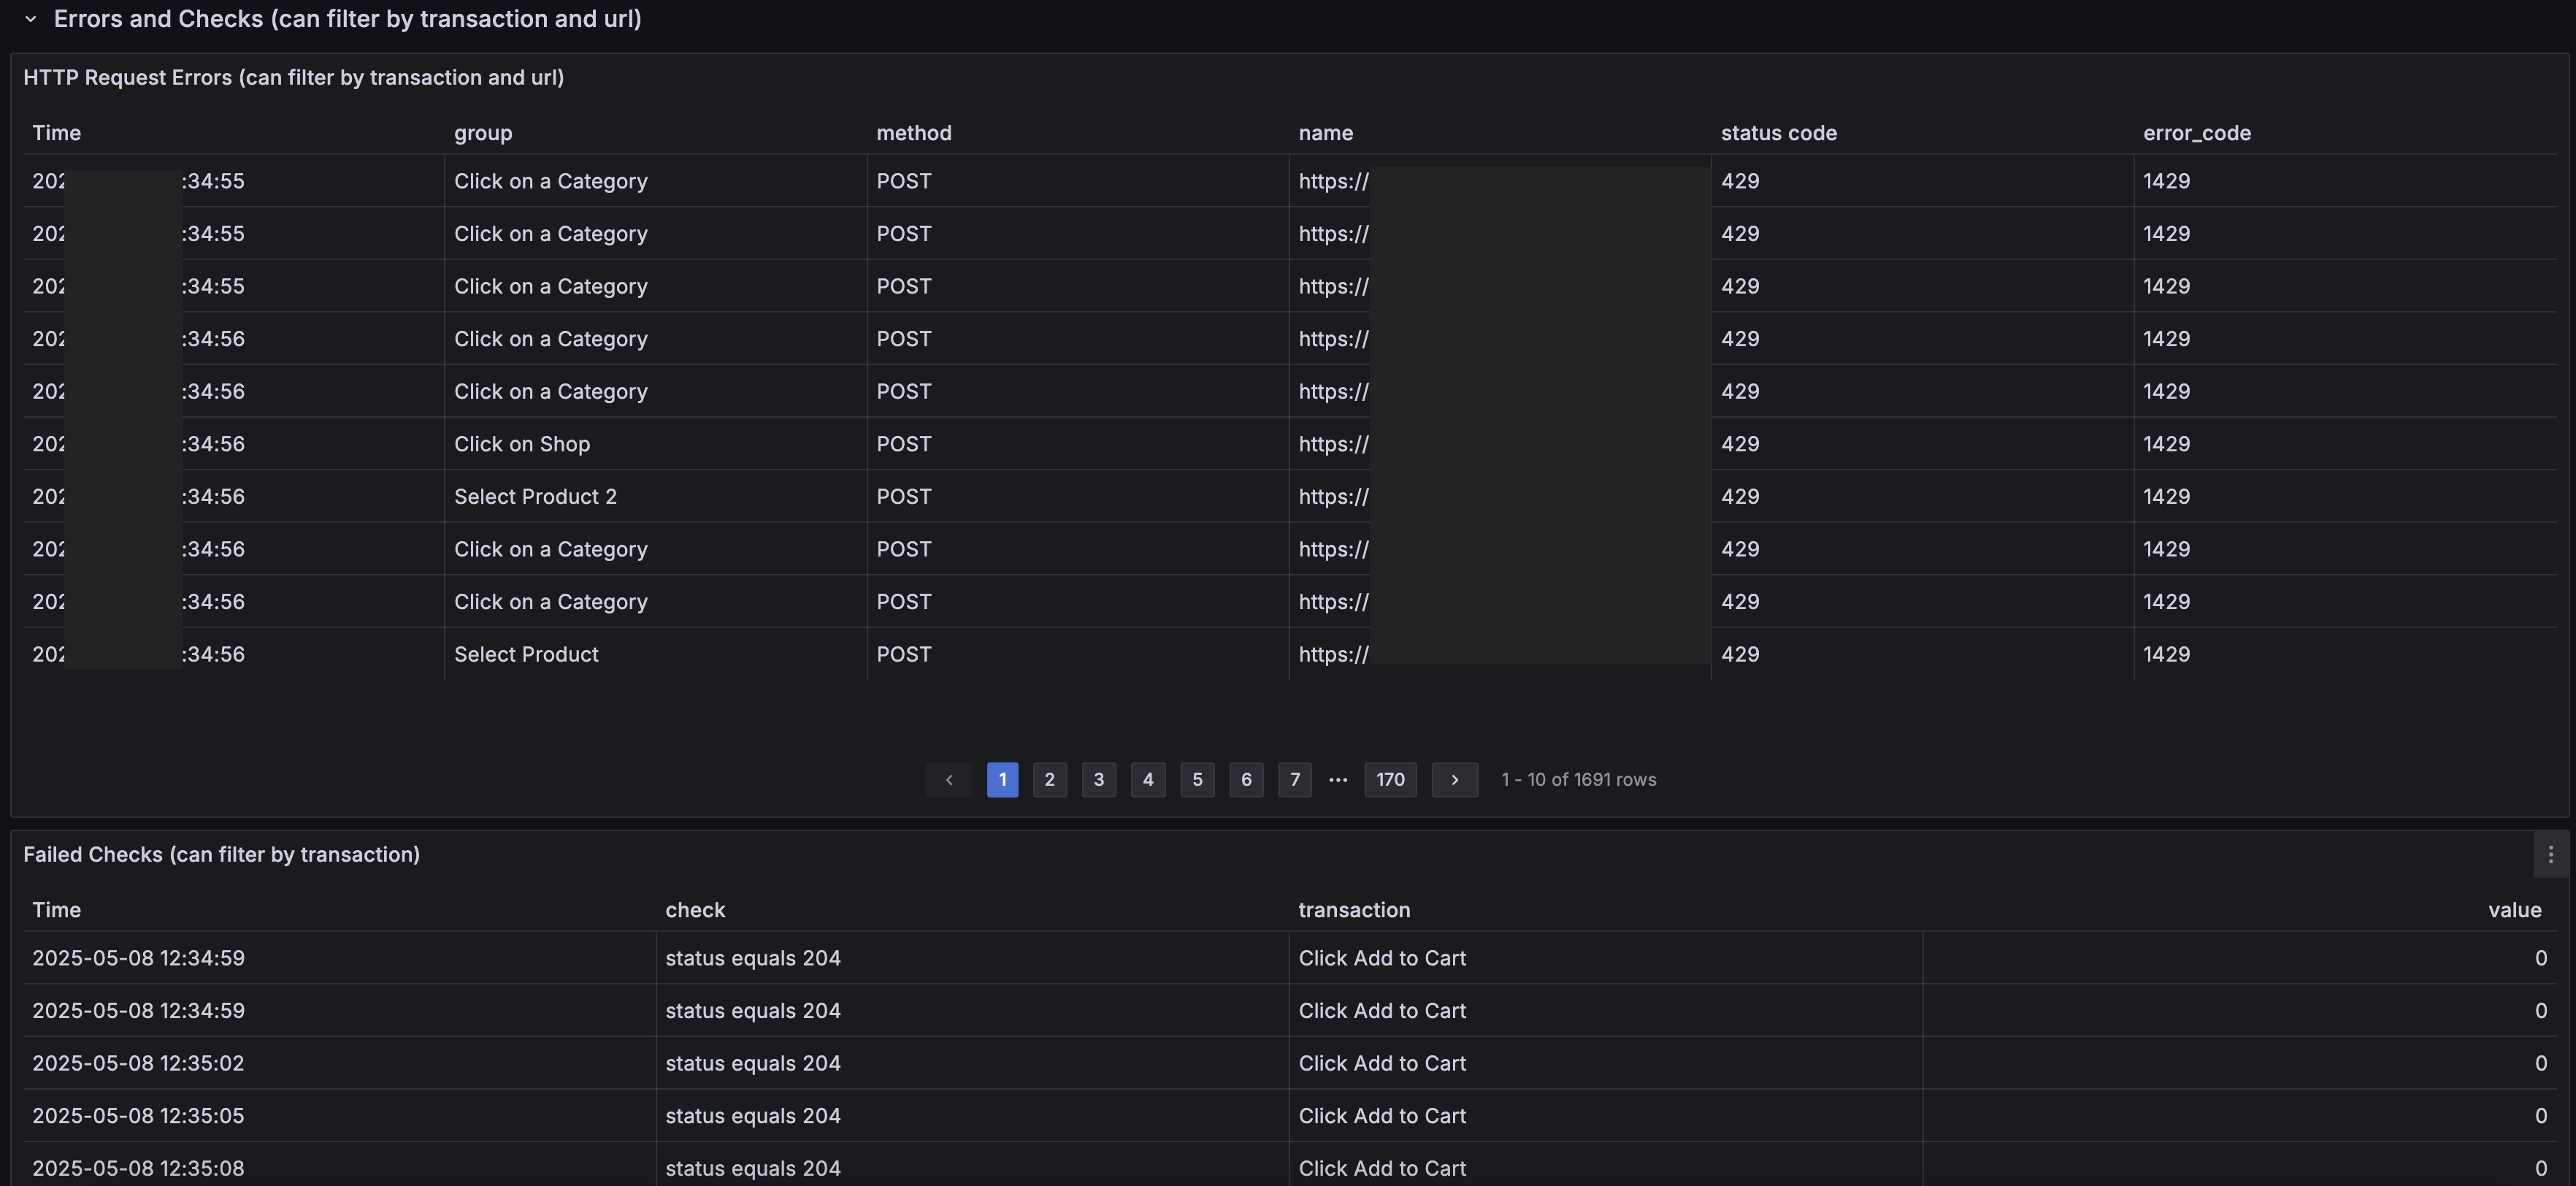
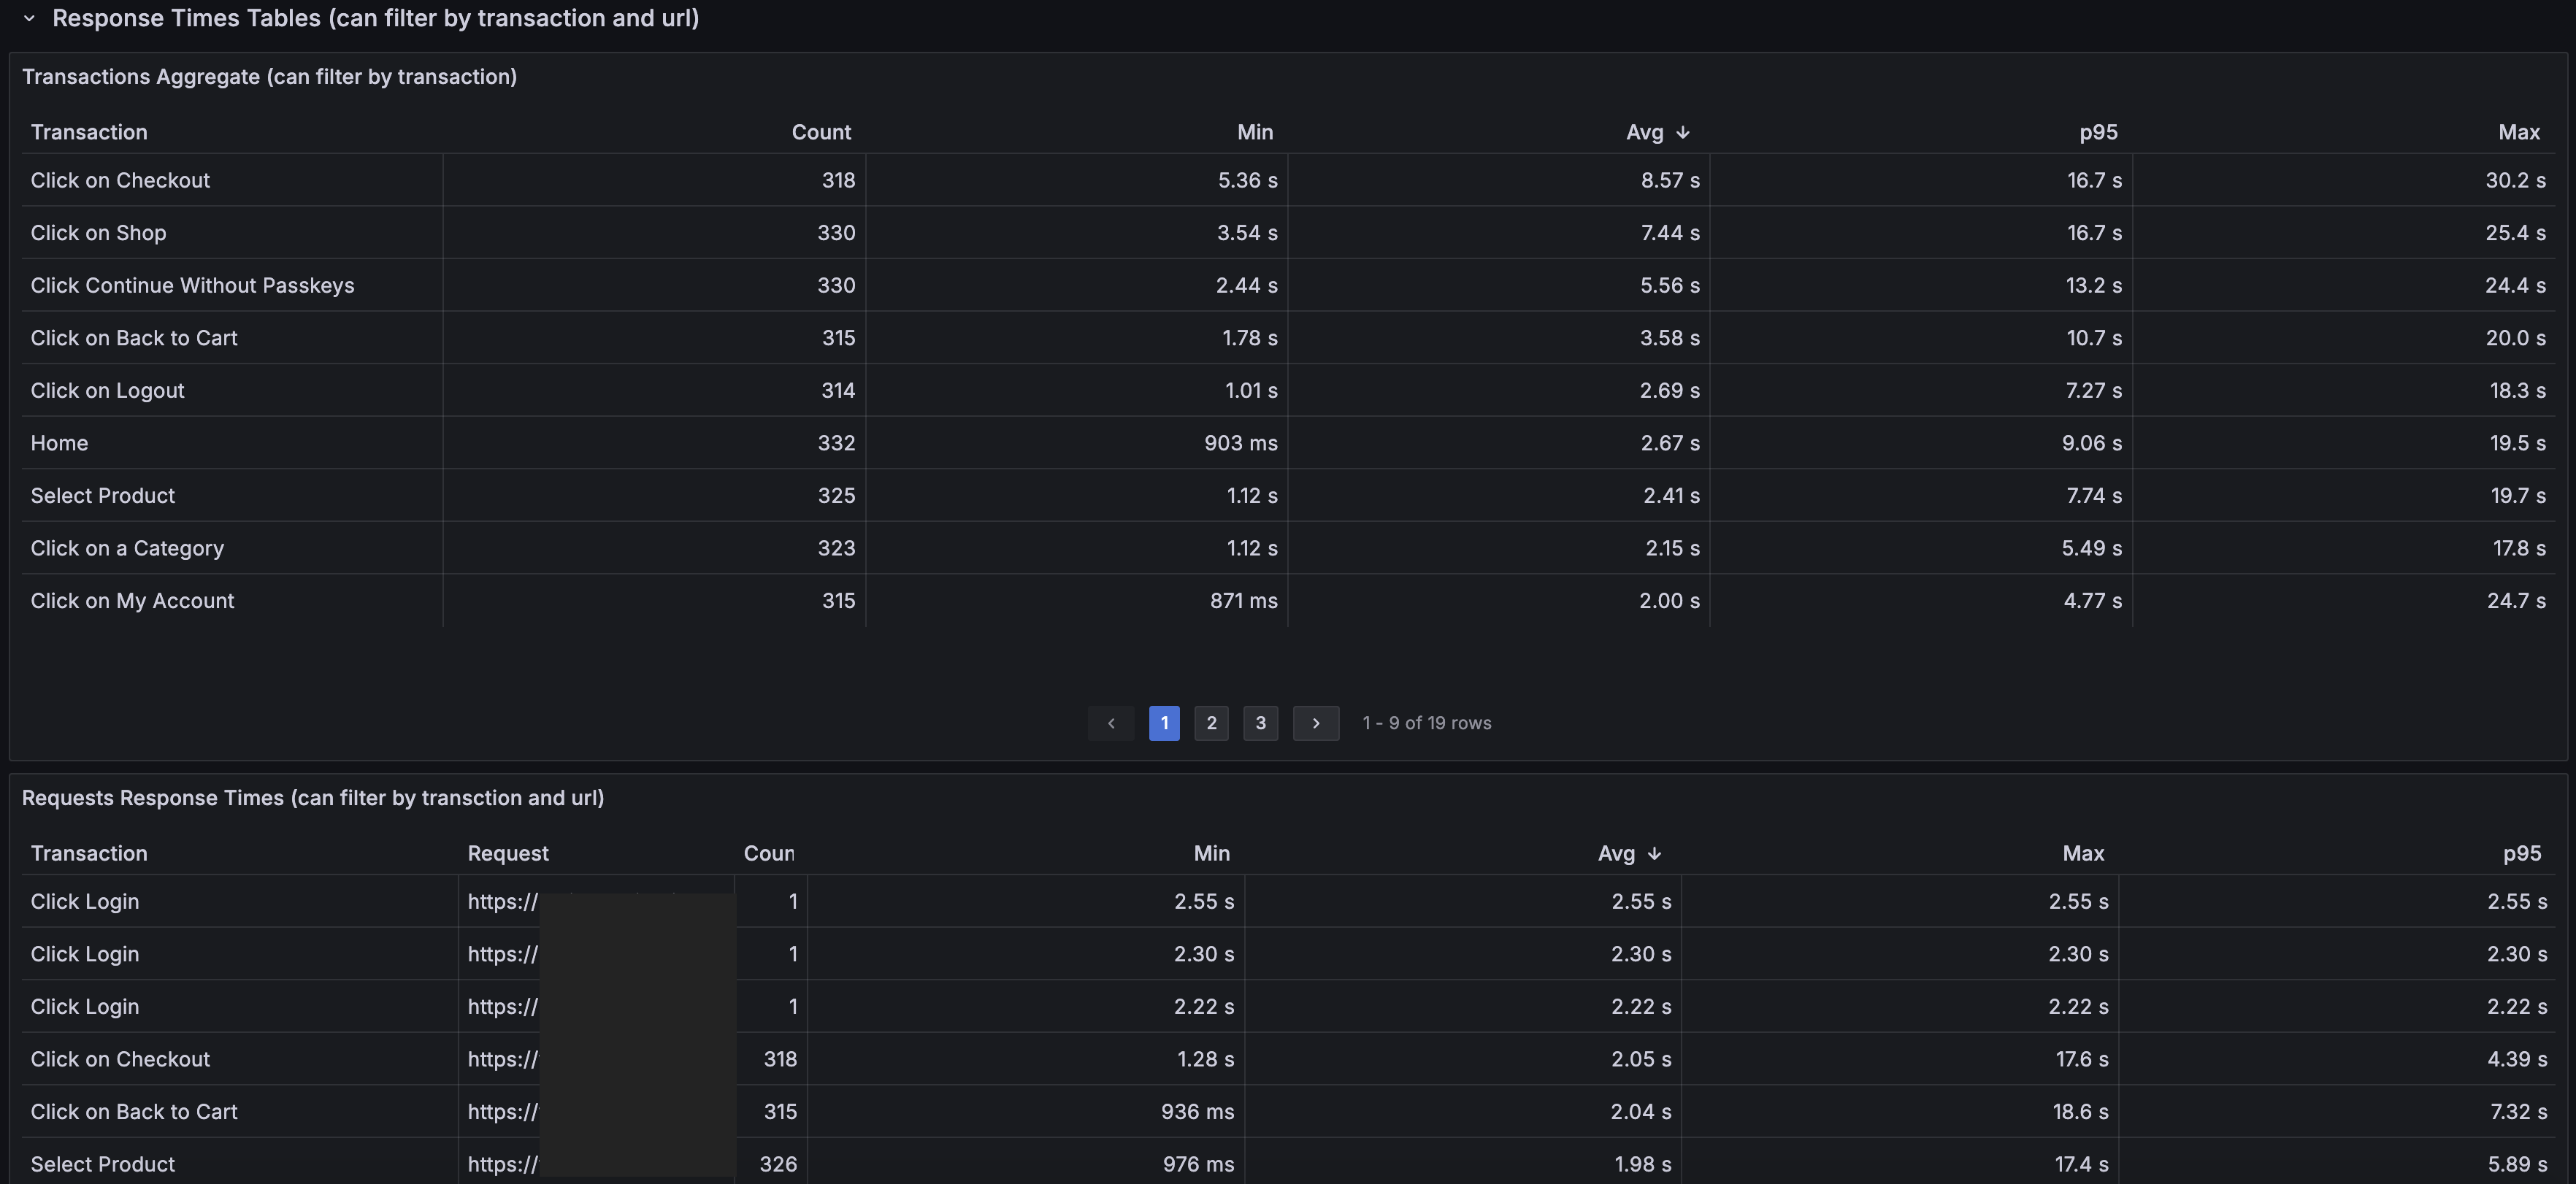
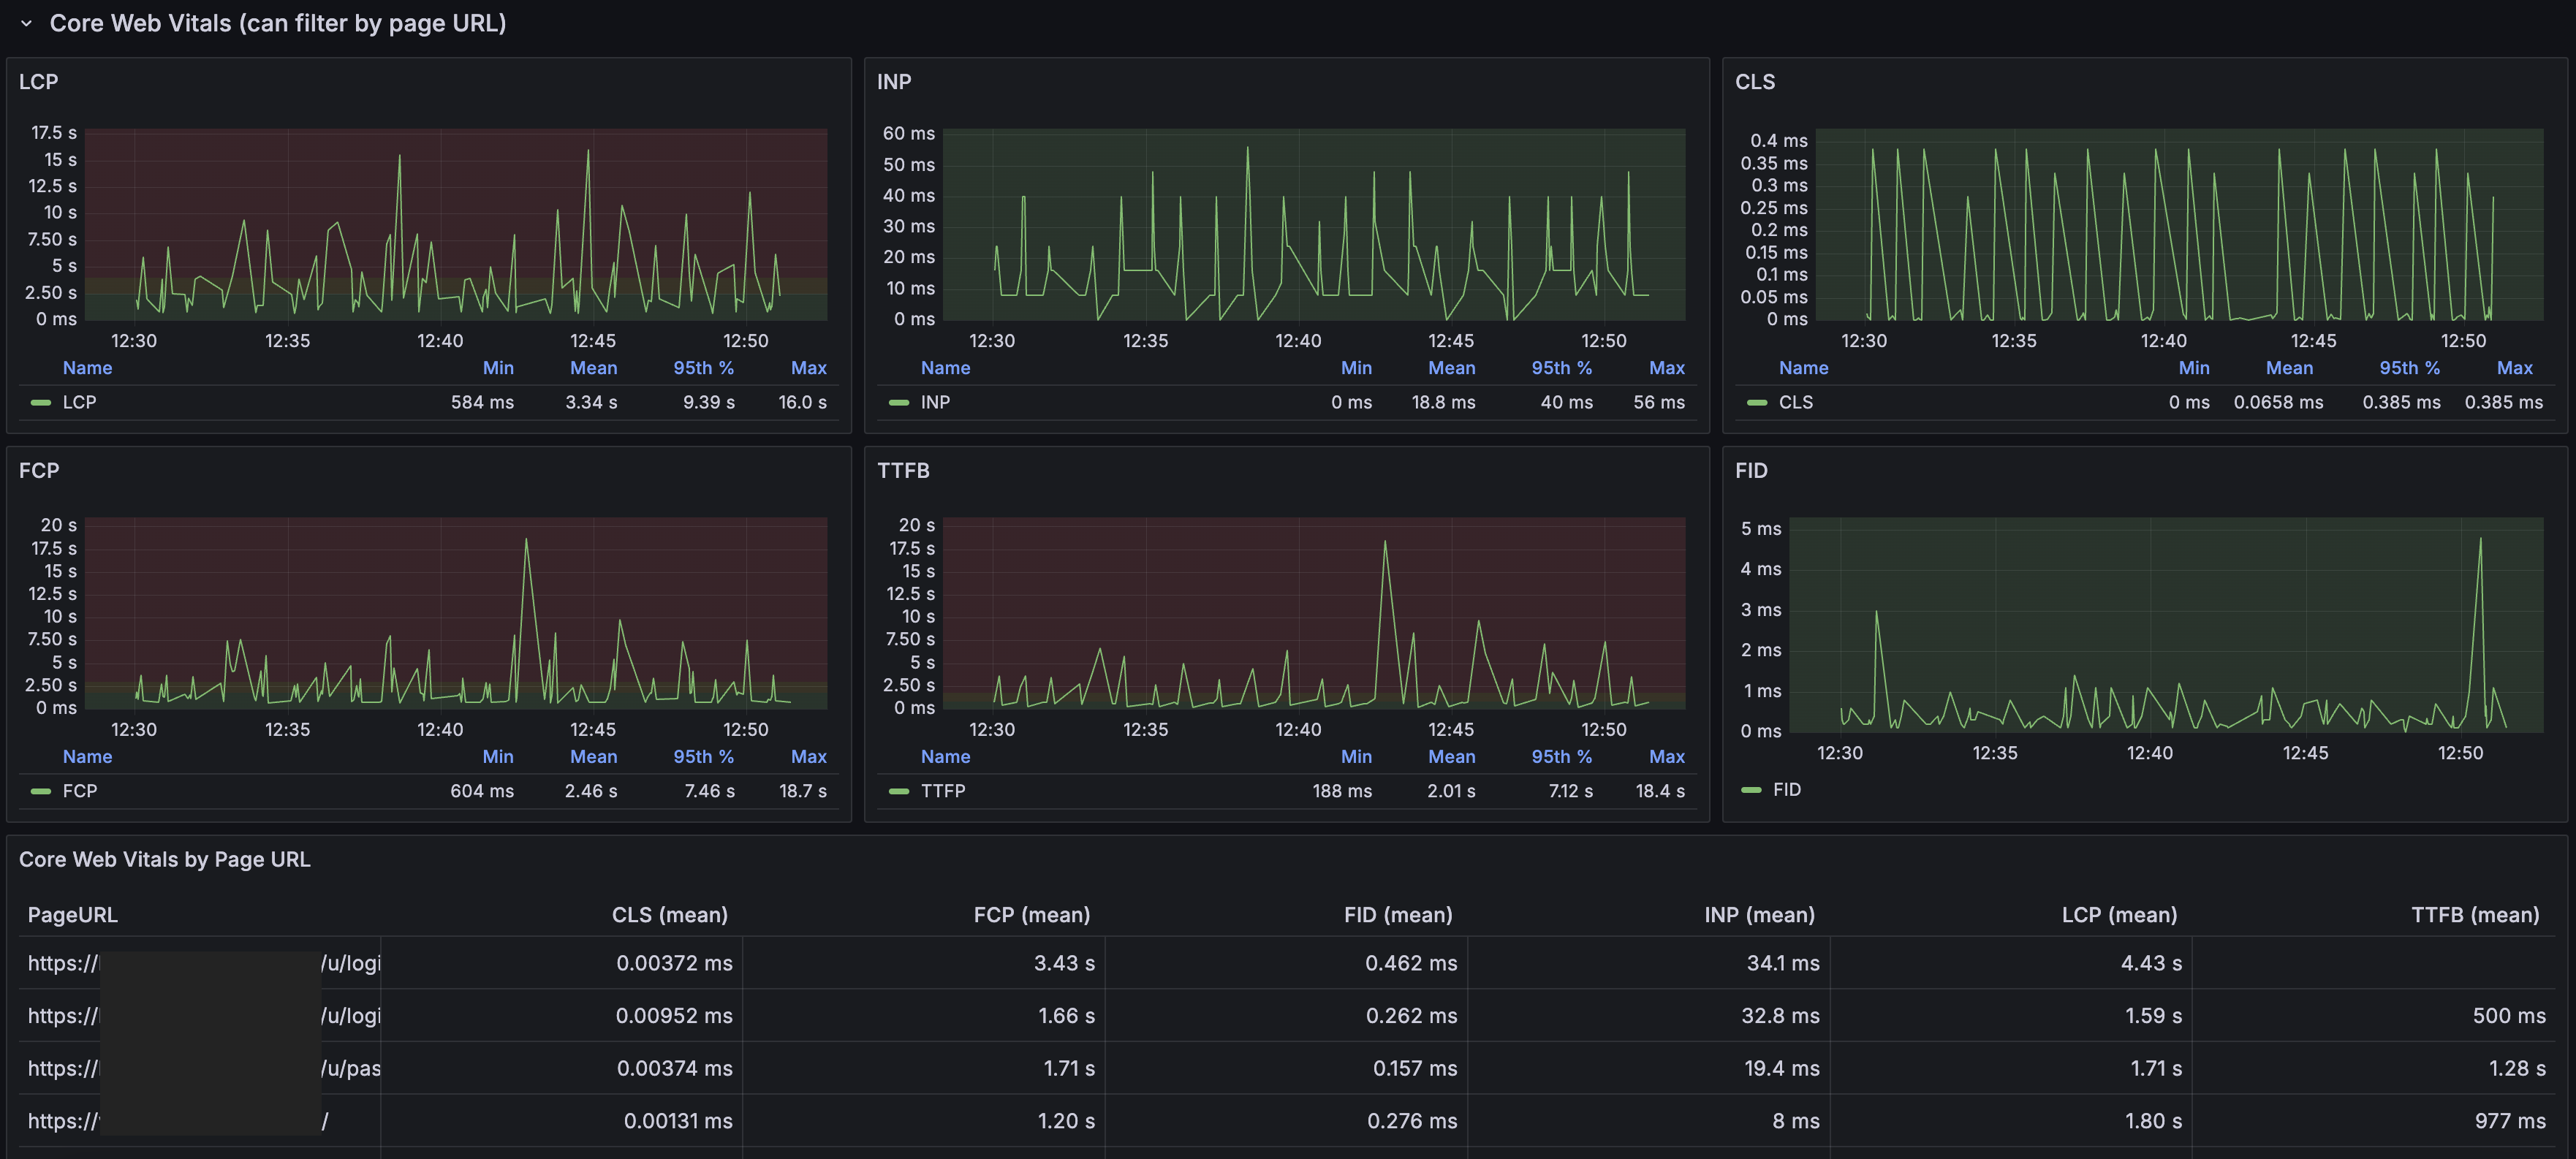
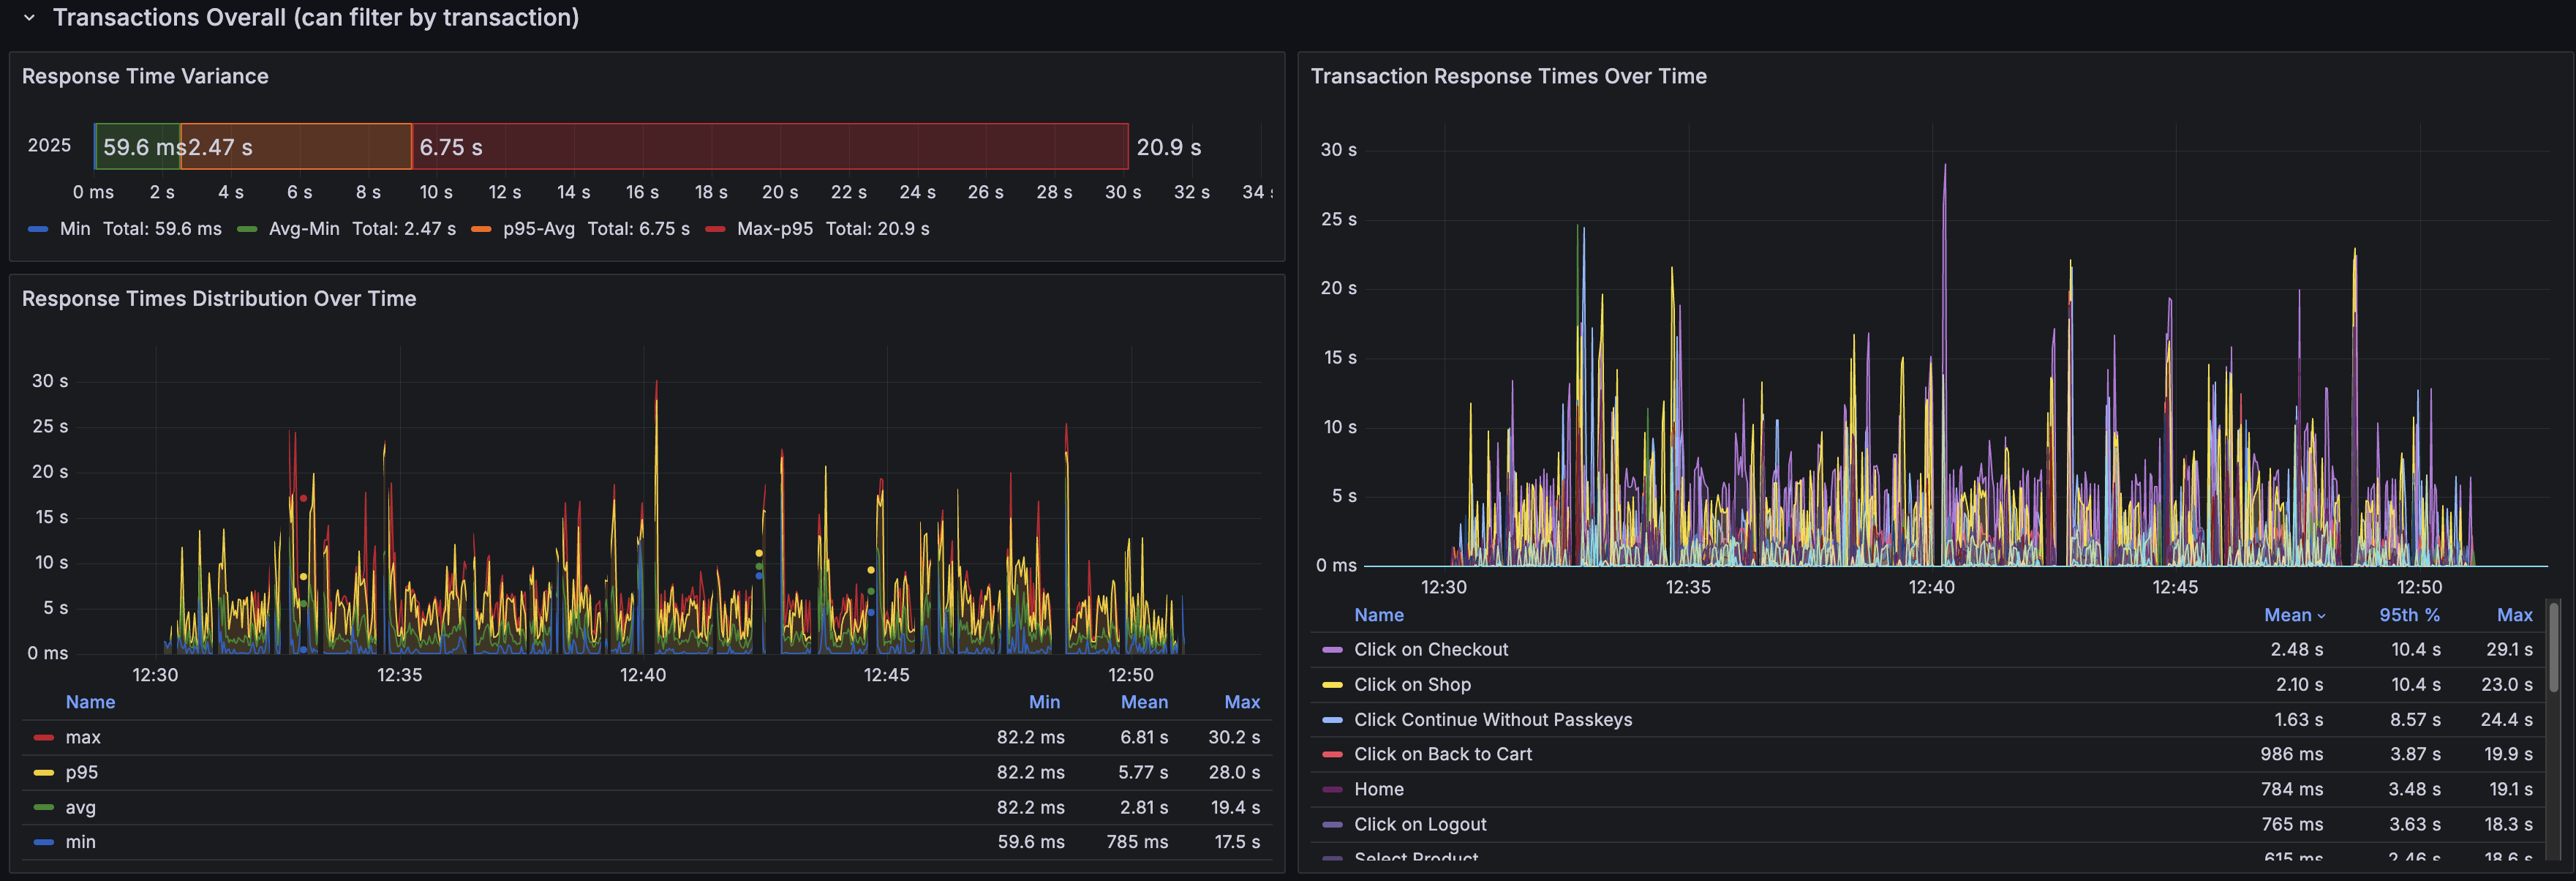
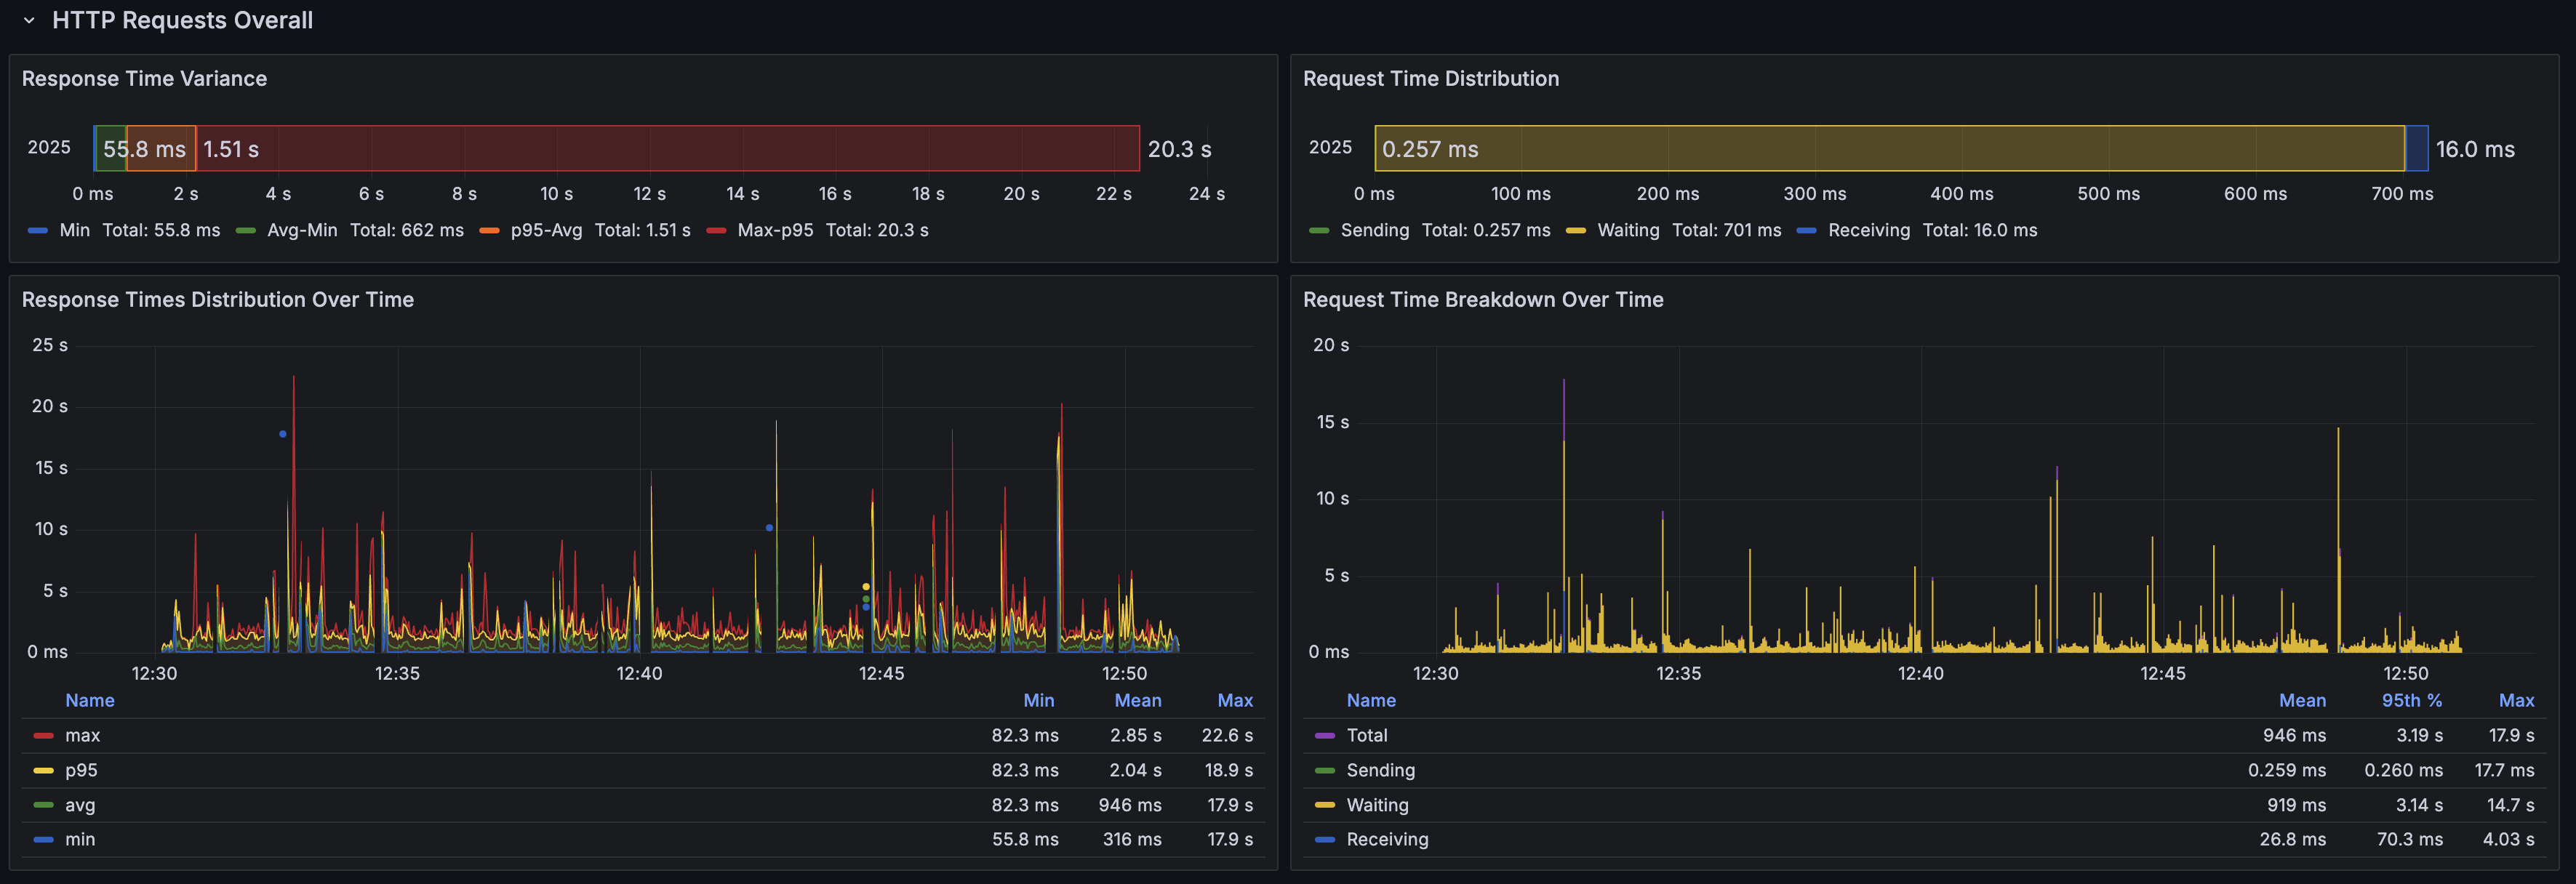
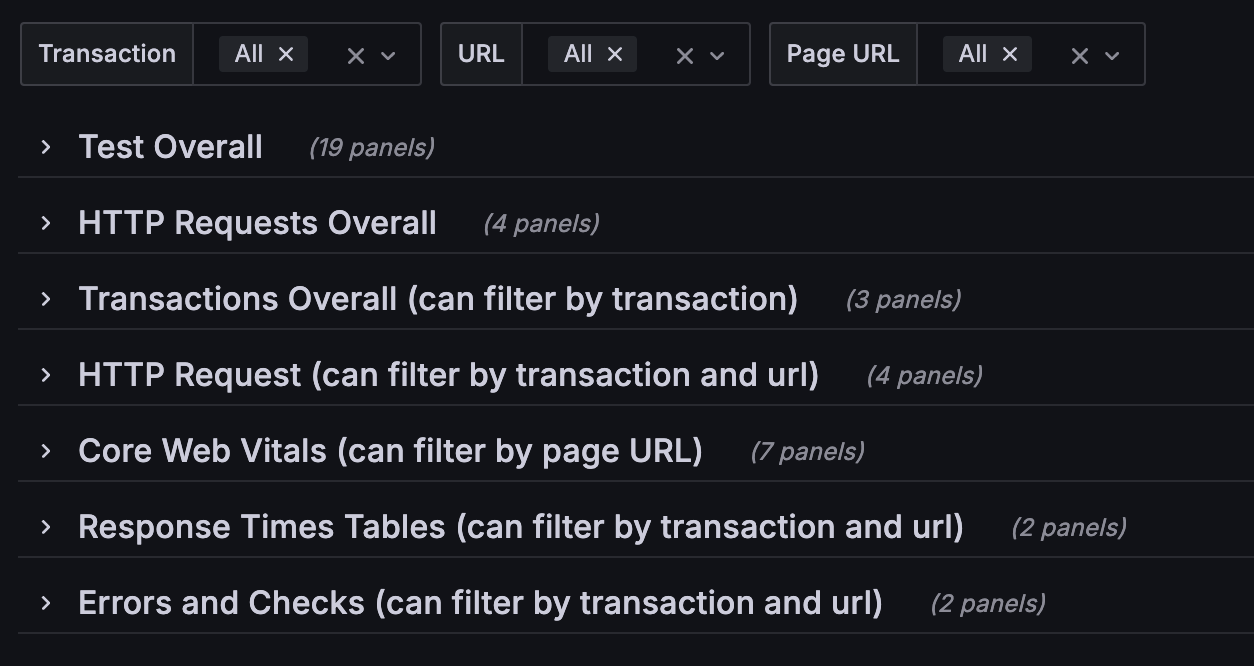
Dashboard for Grafana K6 load test monitoring, troubleshooting and reporting. As concise and minimal as possible, whilst including critical data points. It includes metrics for both Protocol (http_...) and Browser (browser_...) tests. It includes Groups (Transactions) for protocol level testing.
by Juan Trejo (juan@juanmtrejo.com)
Data source config
Collector type:
Collector plugins:
Collector config:
Revisions
Upload an updated version of an exported dashboard.json file from Grafana
| Revision | Description | Created | |
|---|---|---|---|
| Download |