Mssql-Exporter-Prometheus
Works with and ramazantuf/mssql-exporter
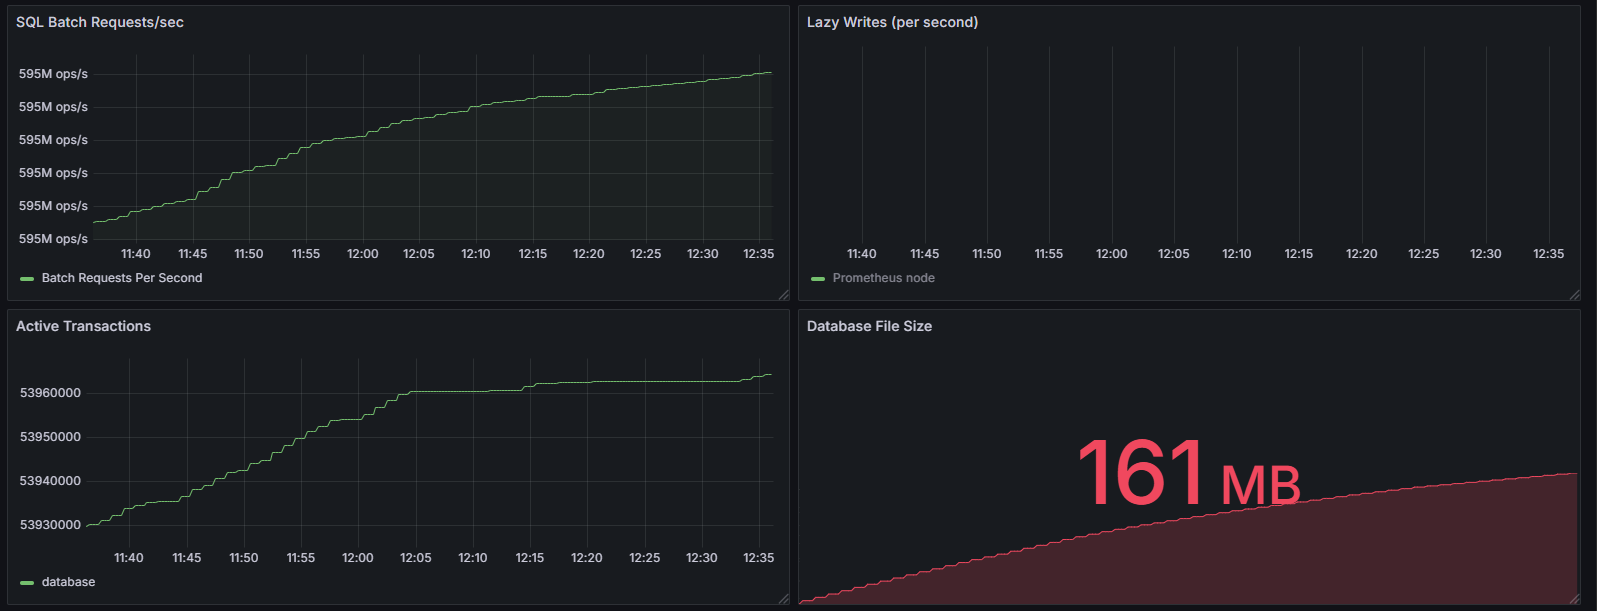
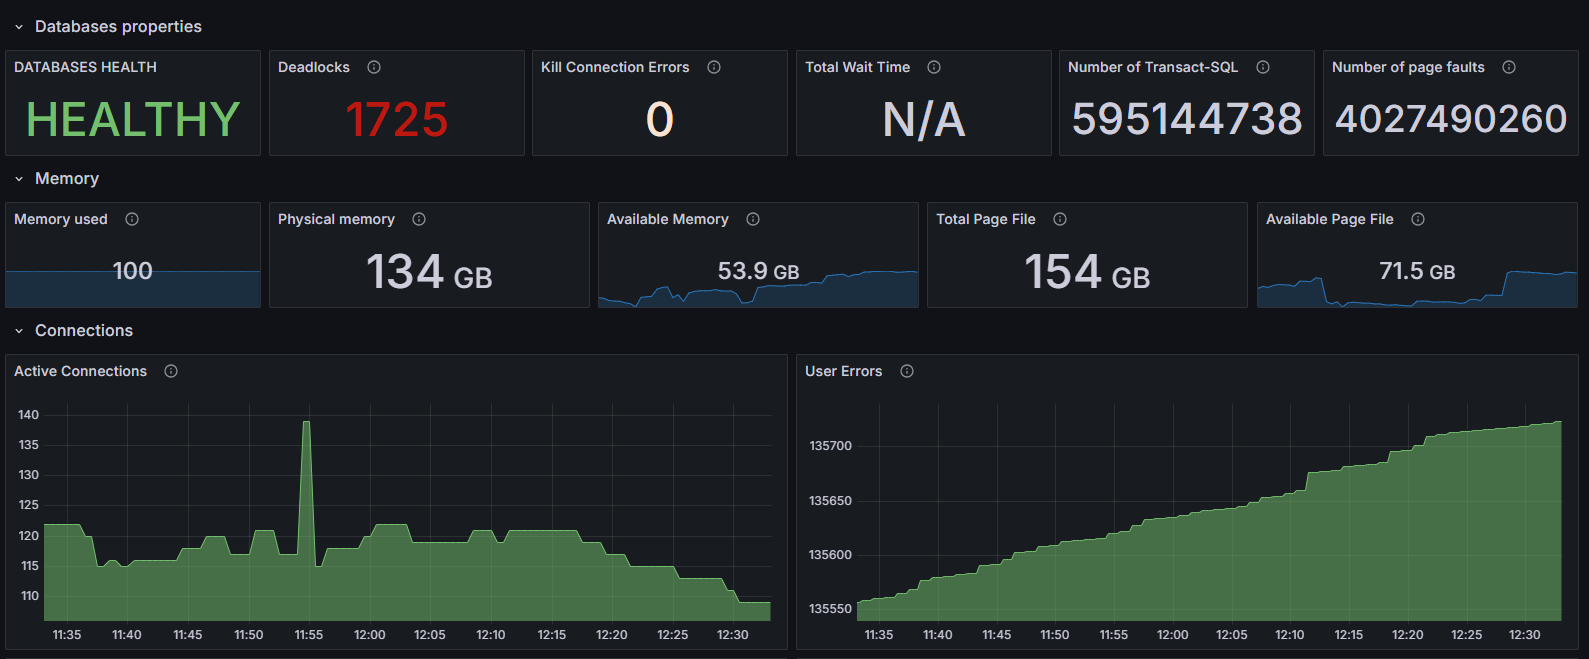
This dashboard provides a comprehensive overview of Microsoft SQL Server (MSSQL) performance metrics. It is designed to help database administrators and DevOps engineers monitor the health, performance, and resource usage of SQL Server instances in real-time.
The metrics are collected using the Prometheus MSSQL Exporter, which exposes SQL Server internals via a /metrics endpoint that Prometheus scrapes at regular intervals.
Data source config
Collector type:
Collector plugins:
Collector config:
Revisions
Upload an updated version of an exported dashboard.json file from Grafana
| Revision | Description | Created | |
|---|---|---|---|
| Download |
Metrics Endpoint (Prometheus)
Easily monitor any Prometheus-compatible and publicly accessible metrics URL with Grafana Cloud's out-of-the-box monitoring solution.
Learn more