NVIDIA DCGM Dashboard for Kubernetes (MIG & Non-MIG GPUs)
This Grafana dashboard uses the NVIDIA DCGM exporter to monitor GPU performance in Kubernetes clusters. Supporting both MIG and non-MIG GPUs, it provides real-time metrics on utilization, memory, temperature, power, and more, enabling efficient management of NVIDIA GPU resources.
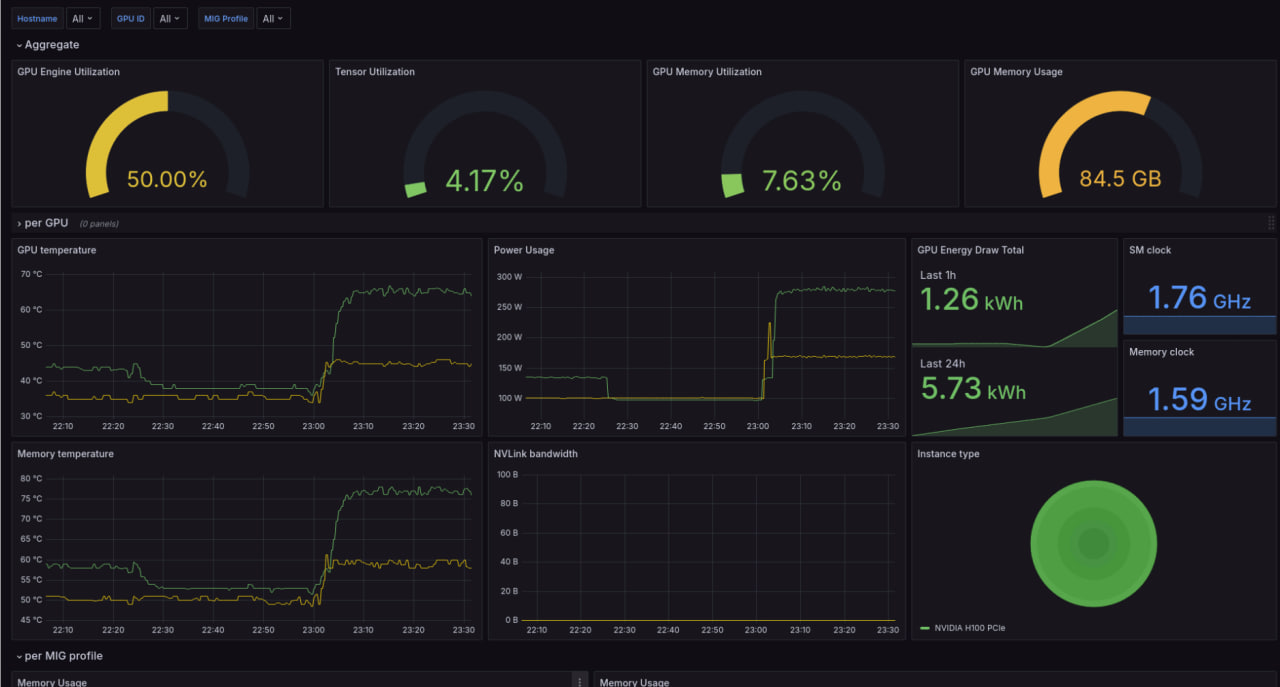
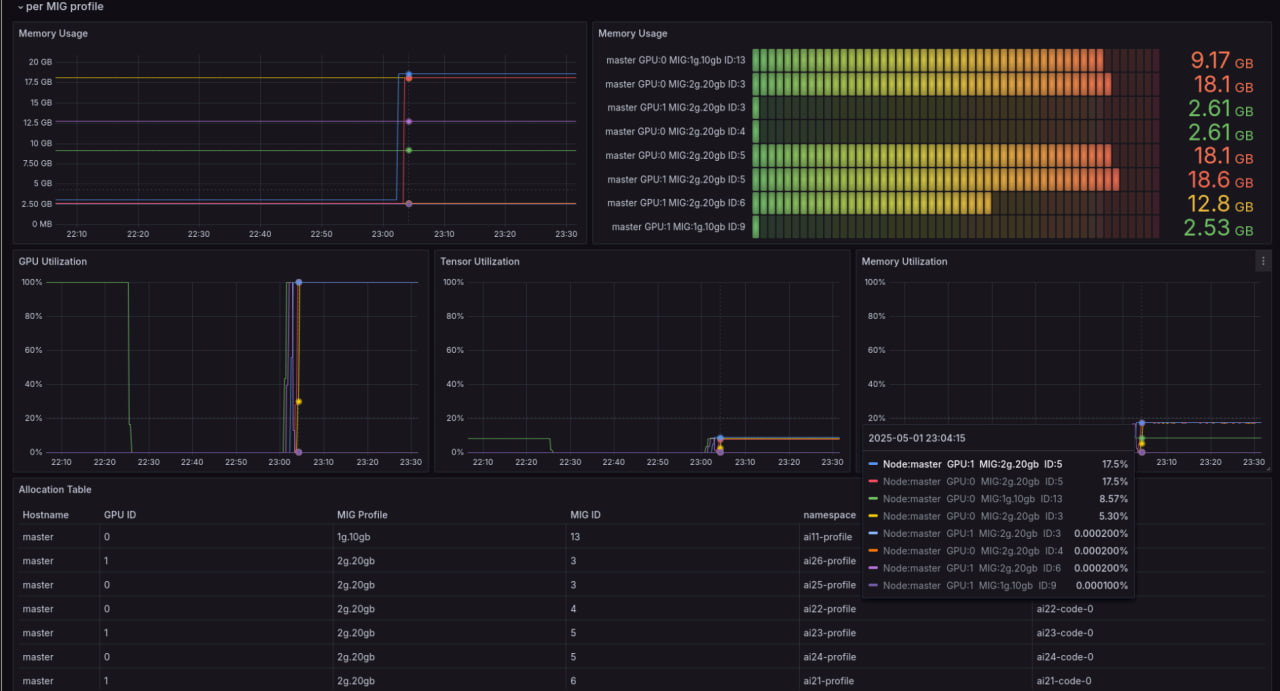
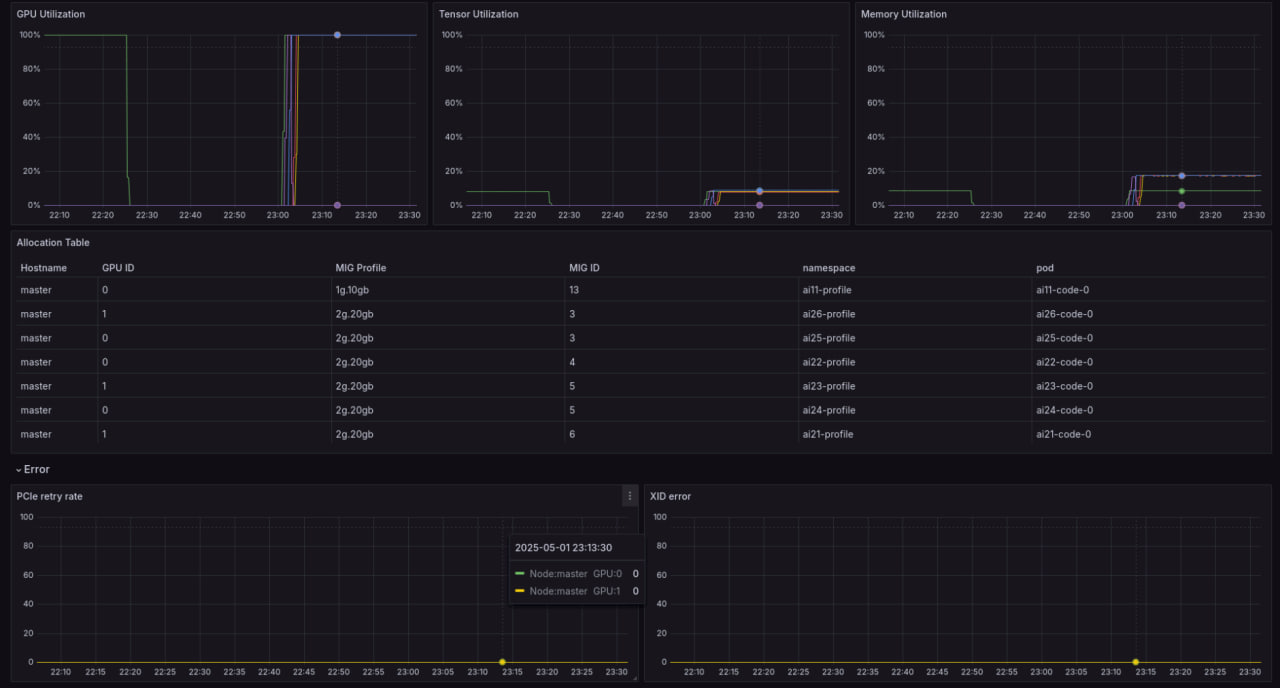
The NVIDIA DCGM Dashboard for Kubernetes (MIG & Non-MIG GPUs) dashboard uses the prometheus data source to create a Grafana dashboard with the bargauge, gauge, piechart, stat, table and timeseries panels.
Data source config
Collector type:
Collector plugins:
Collector config:
Revisions
Upload an updated version of an exported dashboard.json file from Grafana
| Revision | Description | Created | |
|---|---|---|---|
| Download |
Kubernetes
Monitor your Kubernetes deployment with prebuilt visualizations that allow you to drill down from a high-level cluster overview to pod-specific details in minutes.
Learn more