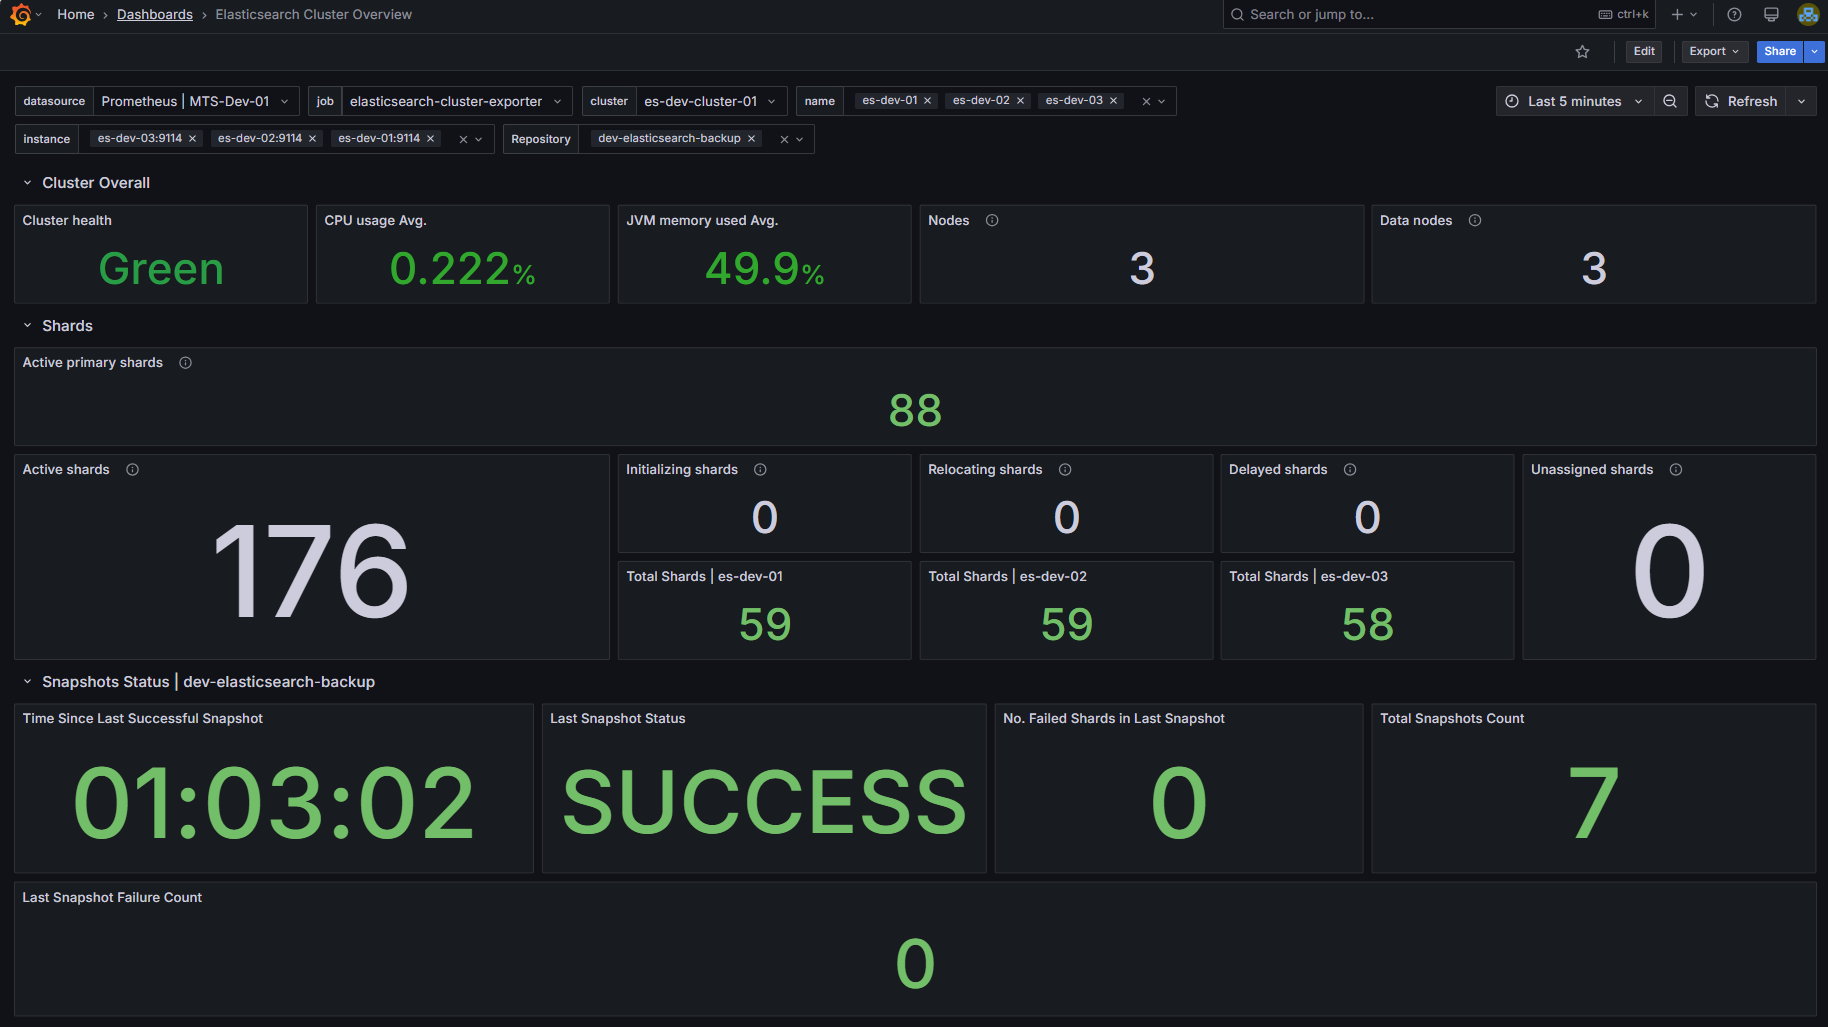
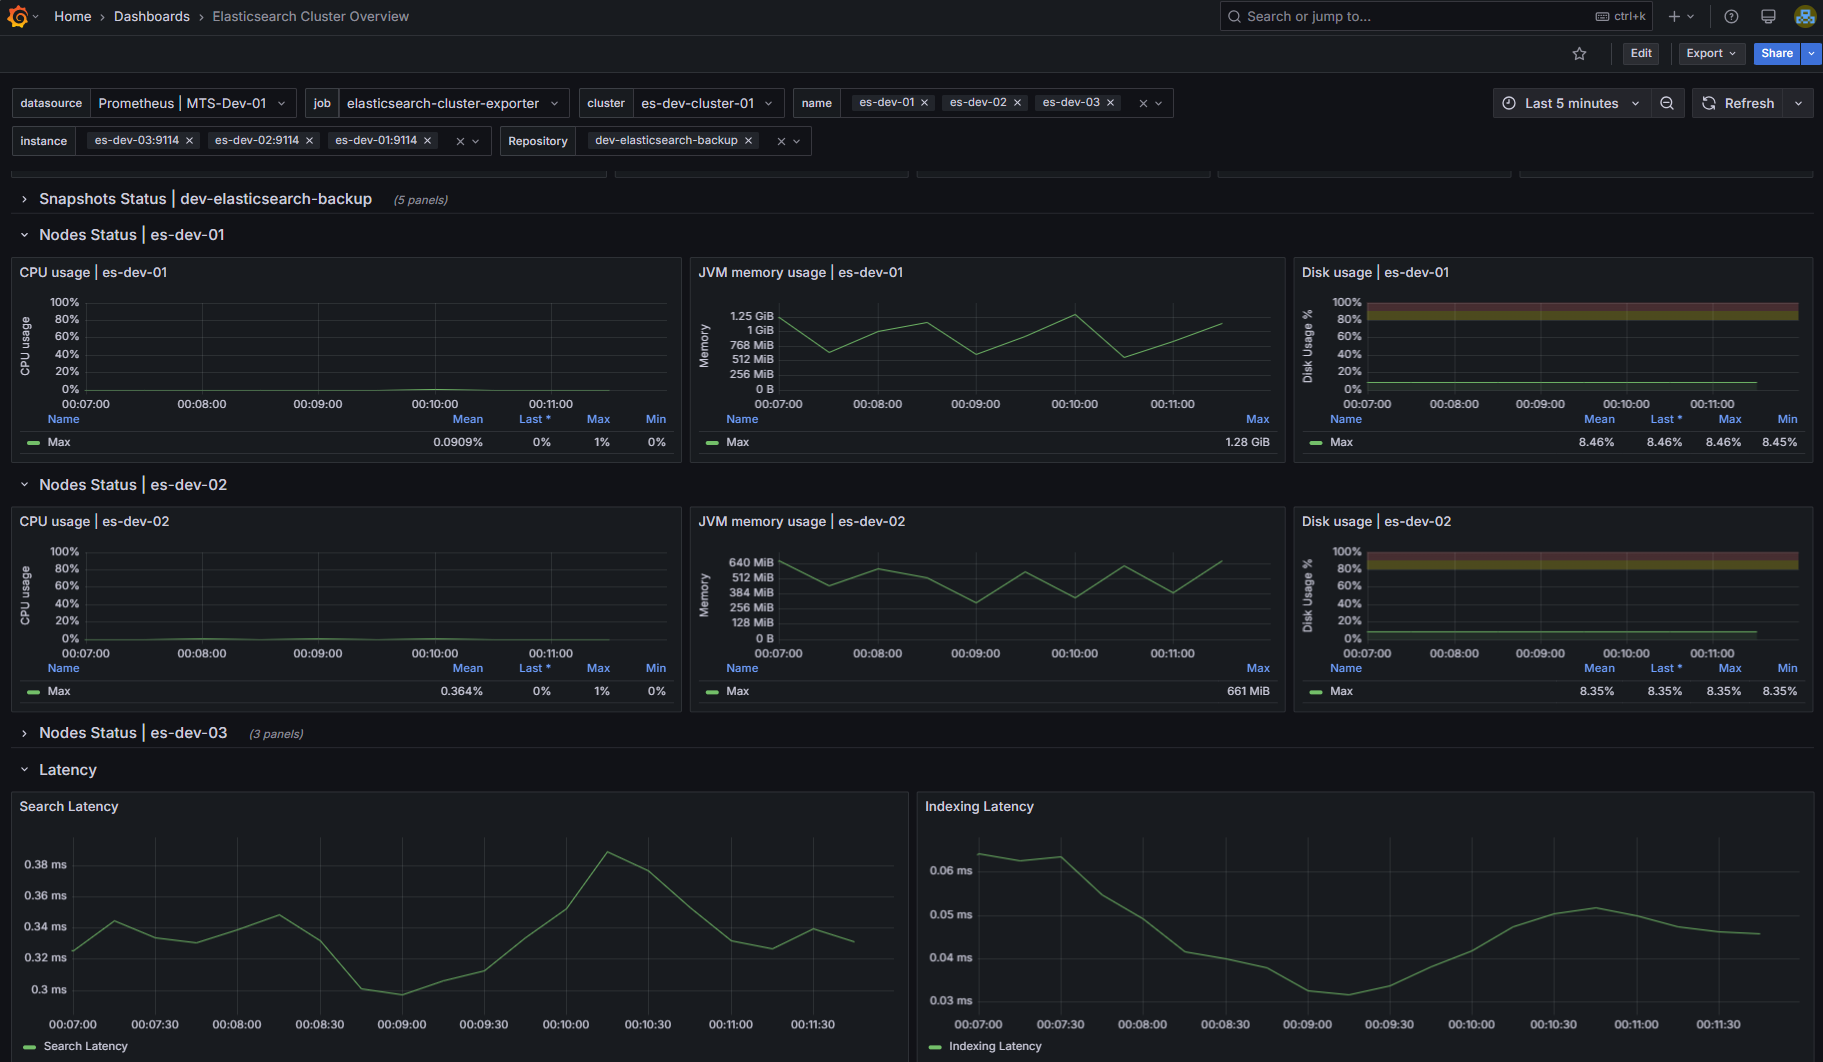
Elasticsearch Cluster Overview (Snapshot Monitoring Included)
This dashboard provides an overview of cluster status, resource usage (CPU, JVM Memory, Disk), shard distribution, search/indexing latency, and snapshot status. Includes per-node breakdowns for detailed analysis.
This dashboard uses the Prometheus Community Elasticsearch Exporter. For setup and configuration, refer to the official documentation: https://github.com/prometheus-community/elasticsearch_exporter.
Data source config
Collector type:
Collector plugins:
Collector config:
Revisions
Upload an updated version of an exported dashboard.json file from Grafana
| Revision | Description | Created | |
|---|---|---|---|
| Download |
Elasticsearch
Easily monitor Elasticsearch, a distributed, multitenant full-text search engine, with Grafana Cloud's out-of-the-box monitoring solution.
Learn more