Couchbase Cluster Overview
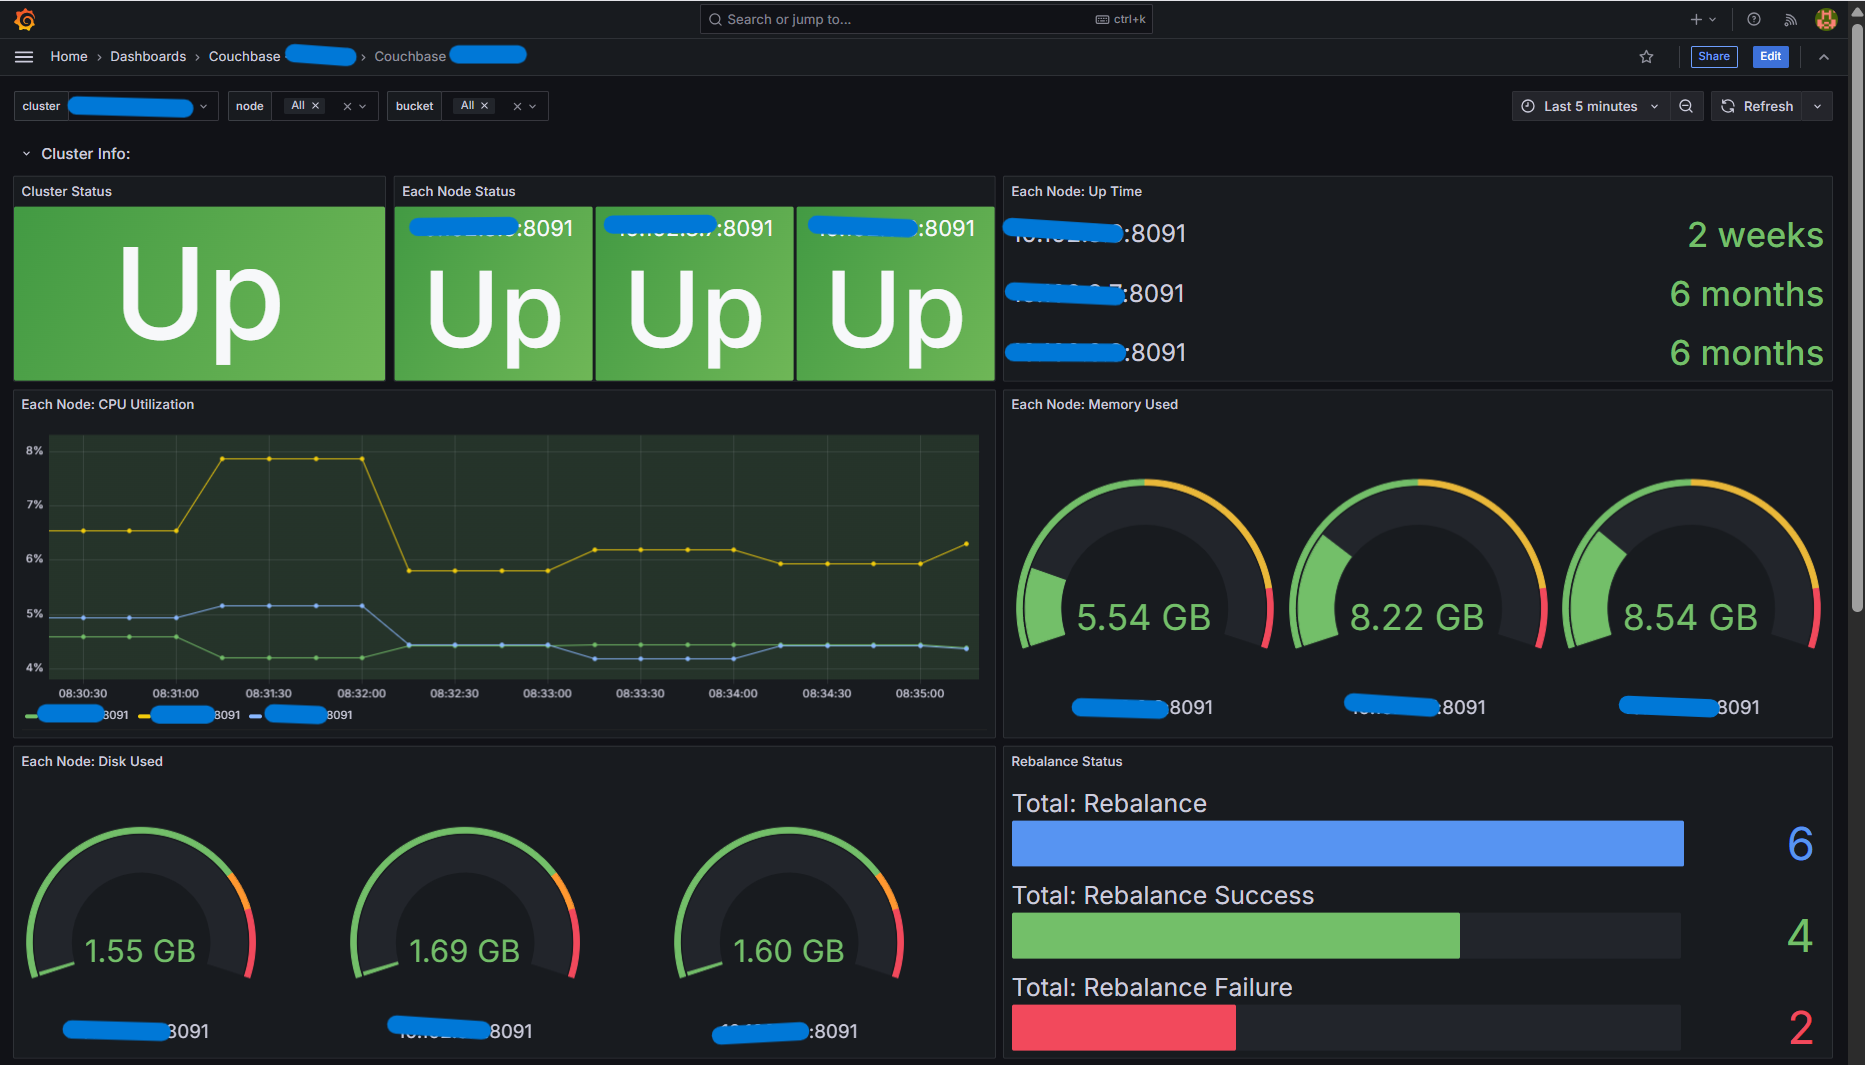
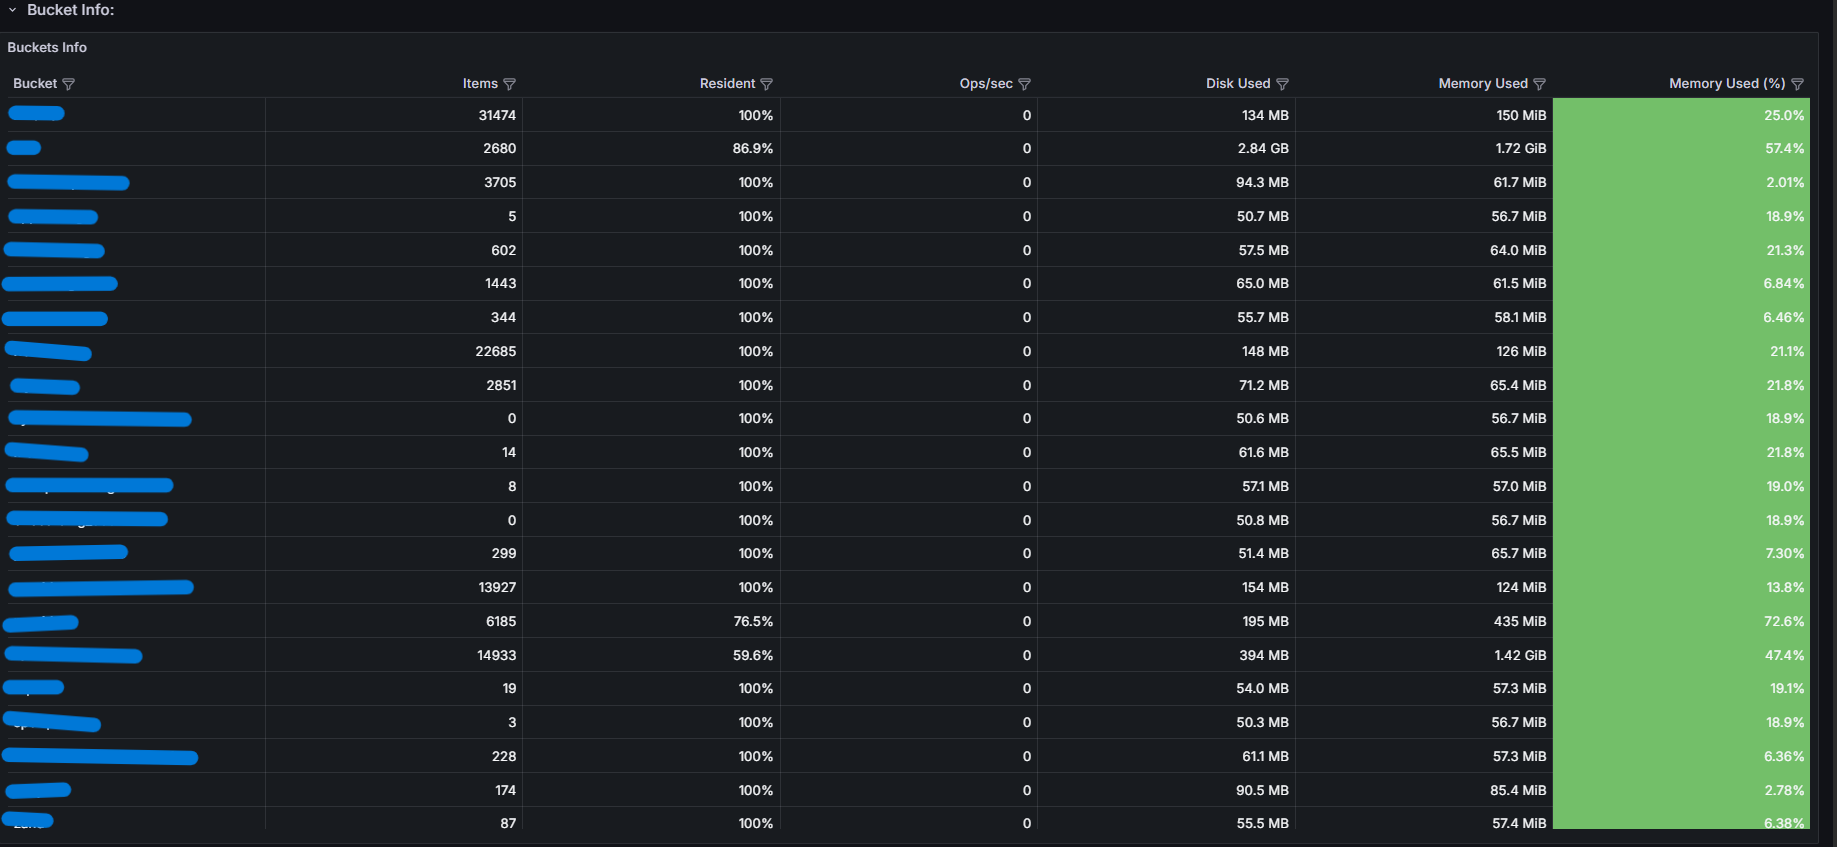
Couchbase cluster overview: Monitors cluster status, each node status, resources (CPU/Mem/Disk) per node, rebalance status, and bucket stats.
This dashboard uses the official Couchbase Prometheus exporter to expose metrics. For setup and configuration, refer to the official documentation: https://github.com/couchbase/couchbase-exporter.
Note: Use required the exact Go version to build Couchbase Prometheus exporter.
Data source config
Collector type:
Collector plugins:
Collector config:
Revisions
Upload an updated version of an exported dashboard.json file from Grafana
| Revision | Description | Created | |
|---|---|---|---|
| Download |
Couchbase
Easily monitor Couchbase, a NoSQL database, with Grafana Cloud's out-of-the-box monitoring solution.
Learn more