ActiveMQ - Artemis
Dashboard for monitoring ActiveMQ Artemis.Git repo: https://github.com/underndog/activemq-helm-chart
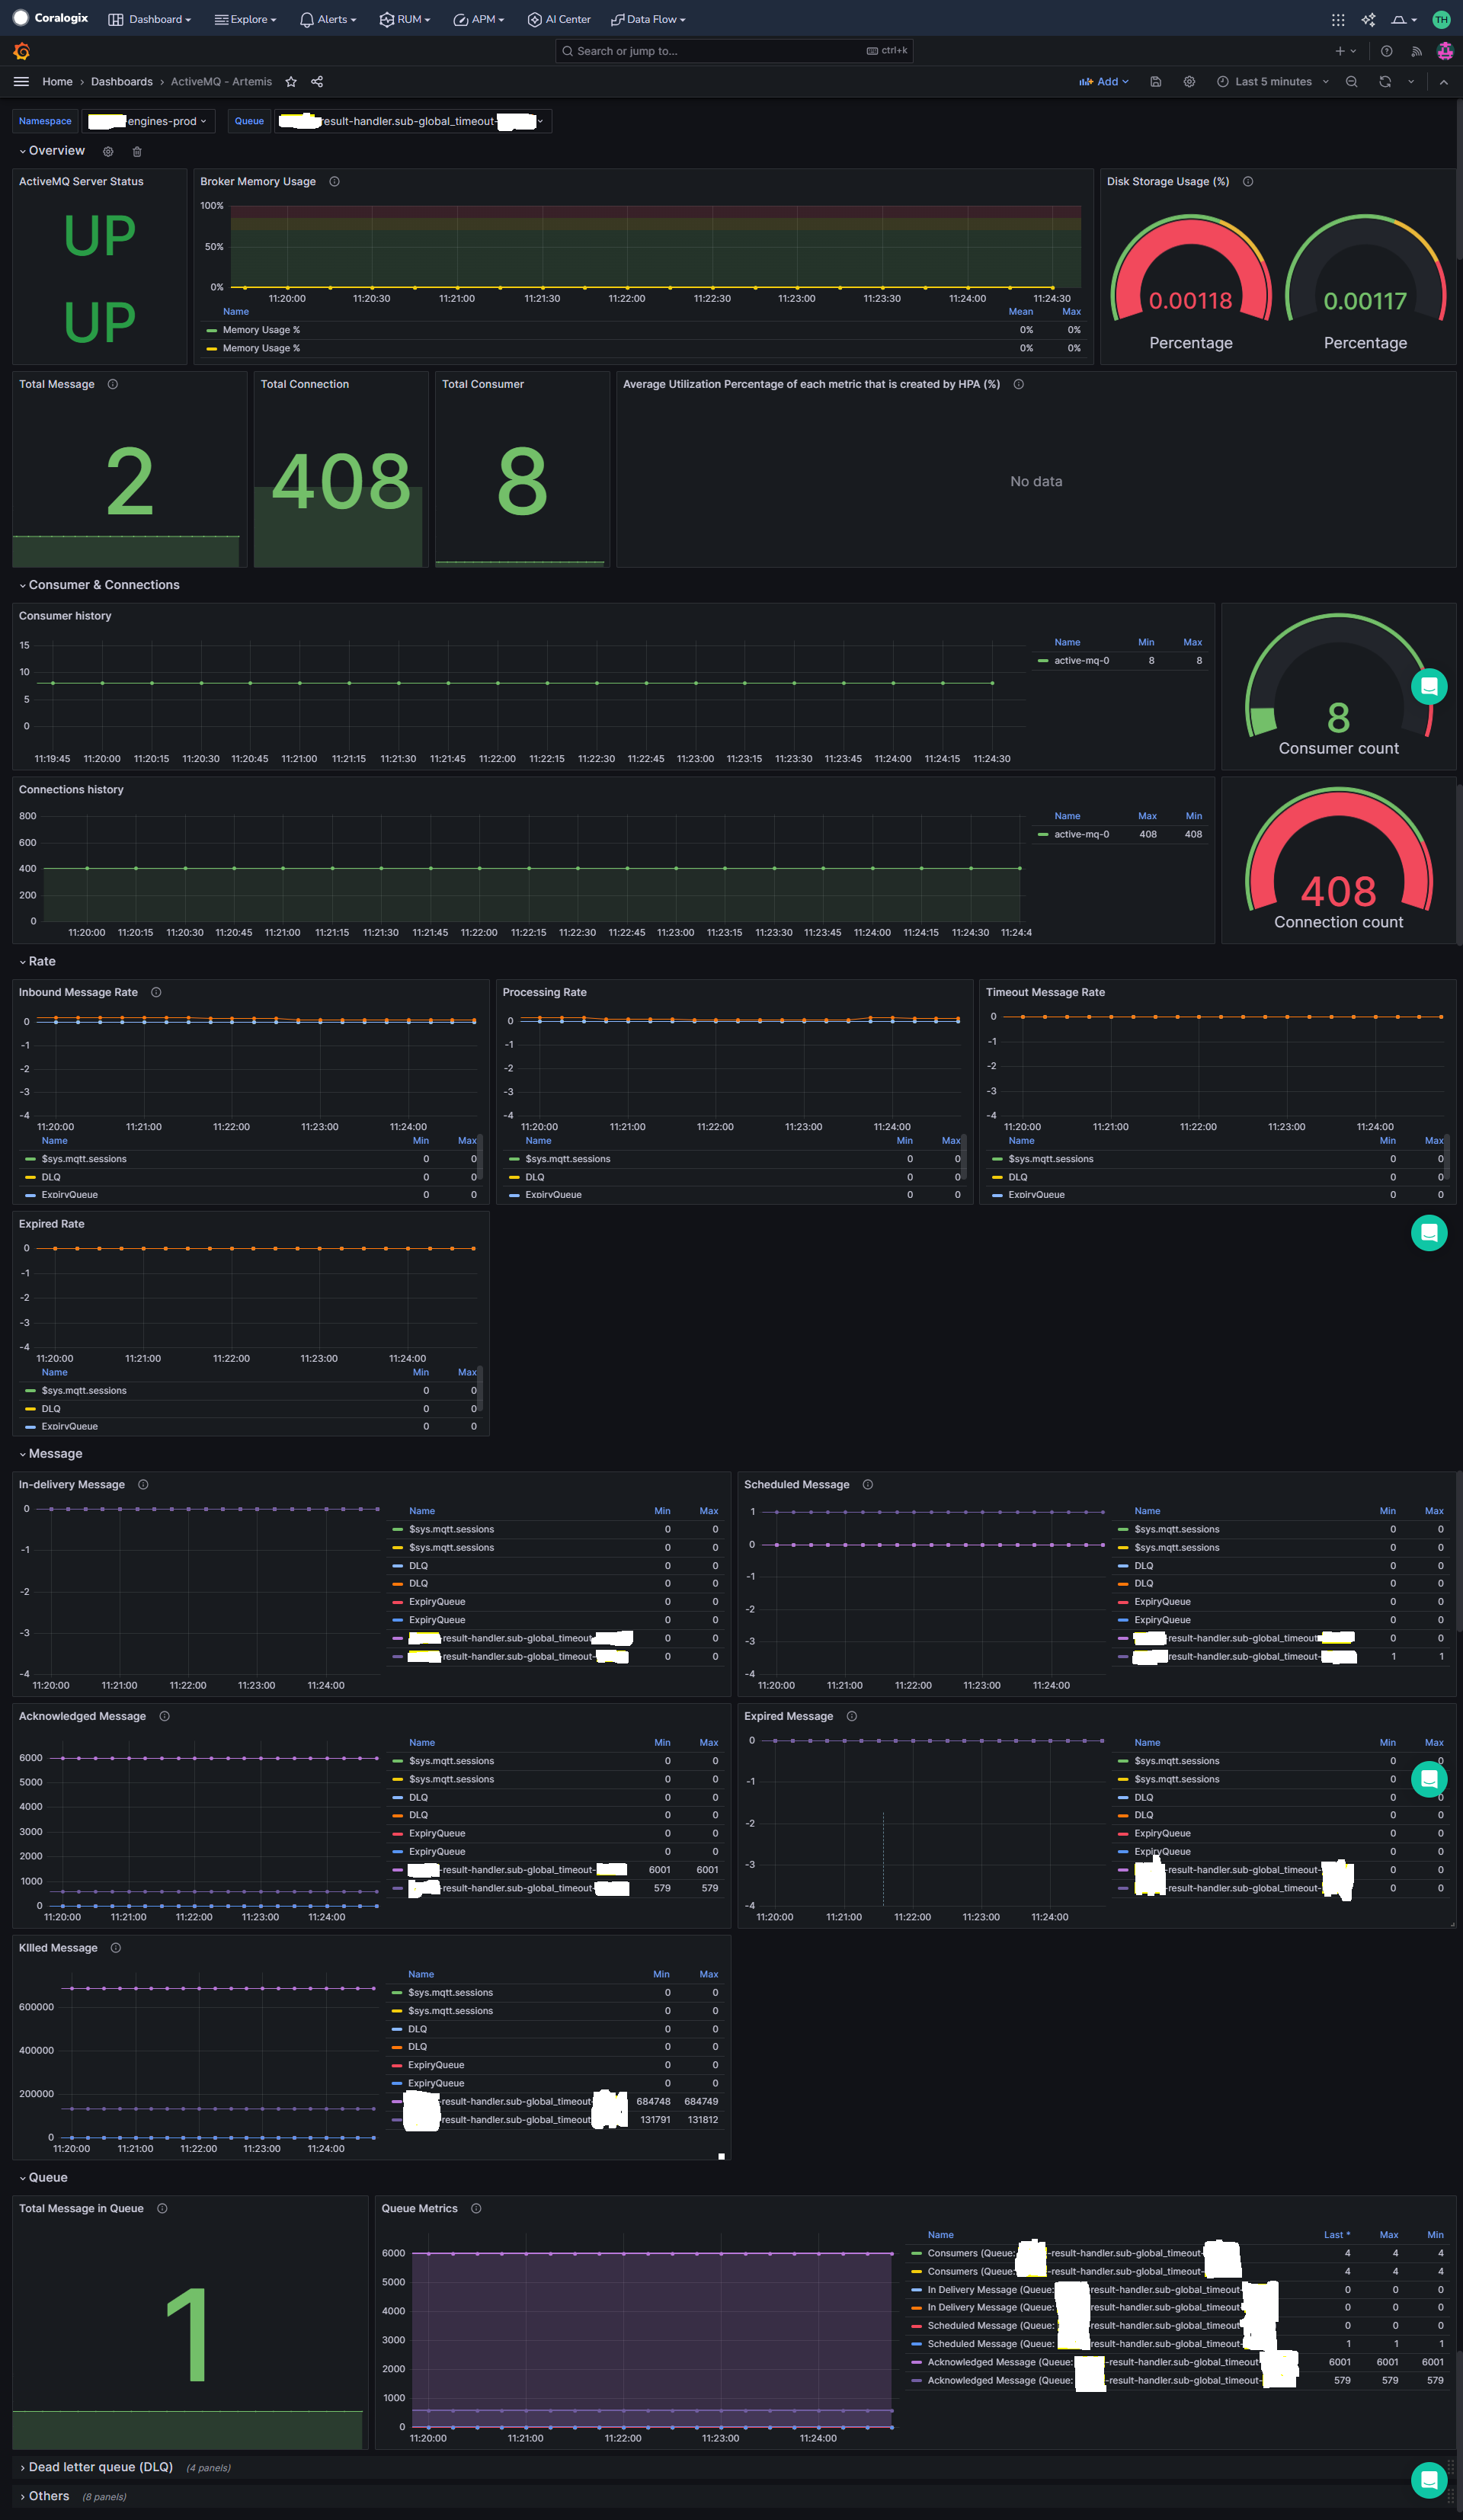
The ActiveMQ - Artemis dashboard uses the prometheus data source to create a Grafana dashboard with the gauge, stat and timeseries panels.
Data source config
Collector type:
Collector plugins:
Collector config:
Revisions
Upload an updated version of an exported dashboard.json file from Grafana
| Revision | Description | Created | |
|---|---|---|---|
| Download |
Apache ActiveMQ
Easily monitor Apache ActiveMQ, an open source message broker software, with Grafana Cloud's out-of-the-box monitoring solution.
Learn more