Advanced k6 Load Test Monitoring Dashboard by Dinesh Raja
Advanced dashboard for visualizing performance KPI results from the k6.io load testing tool, using the InfluxDB 1.x OSS exporter
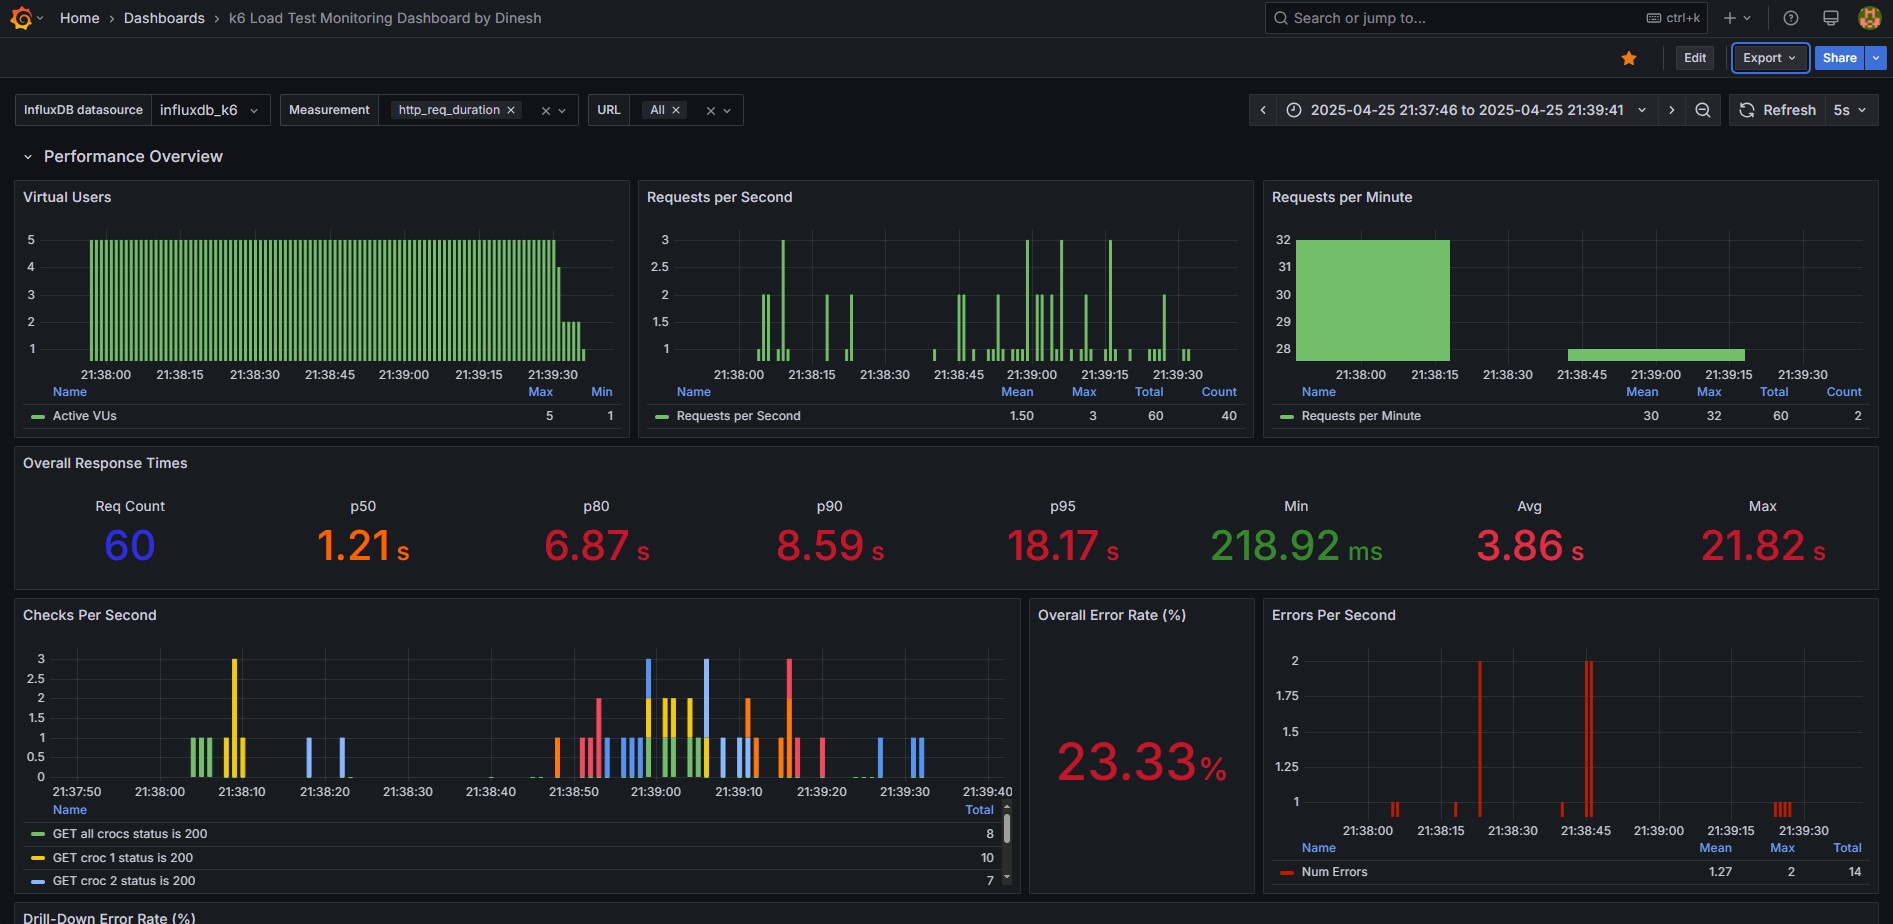
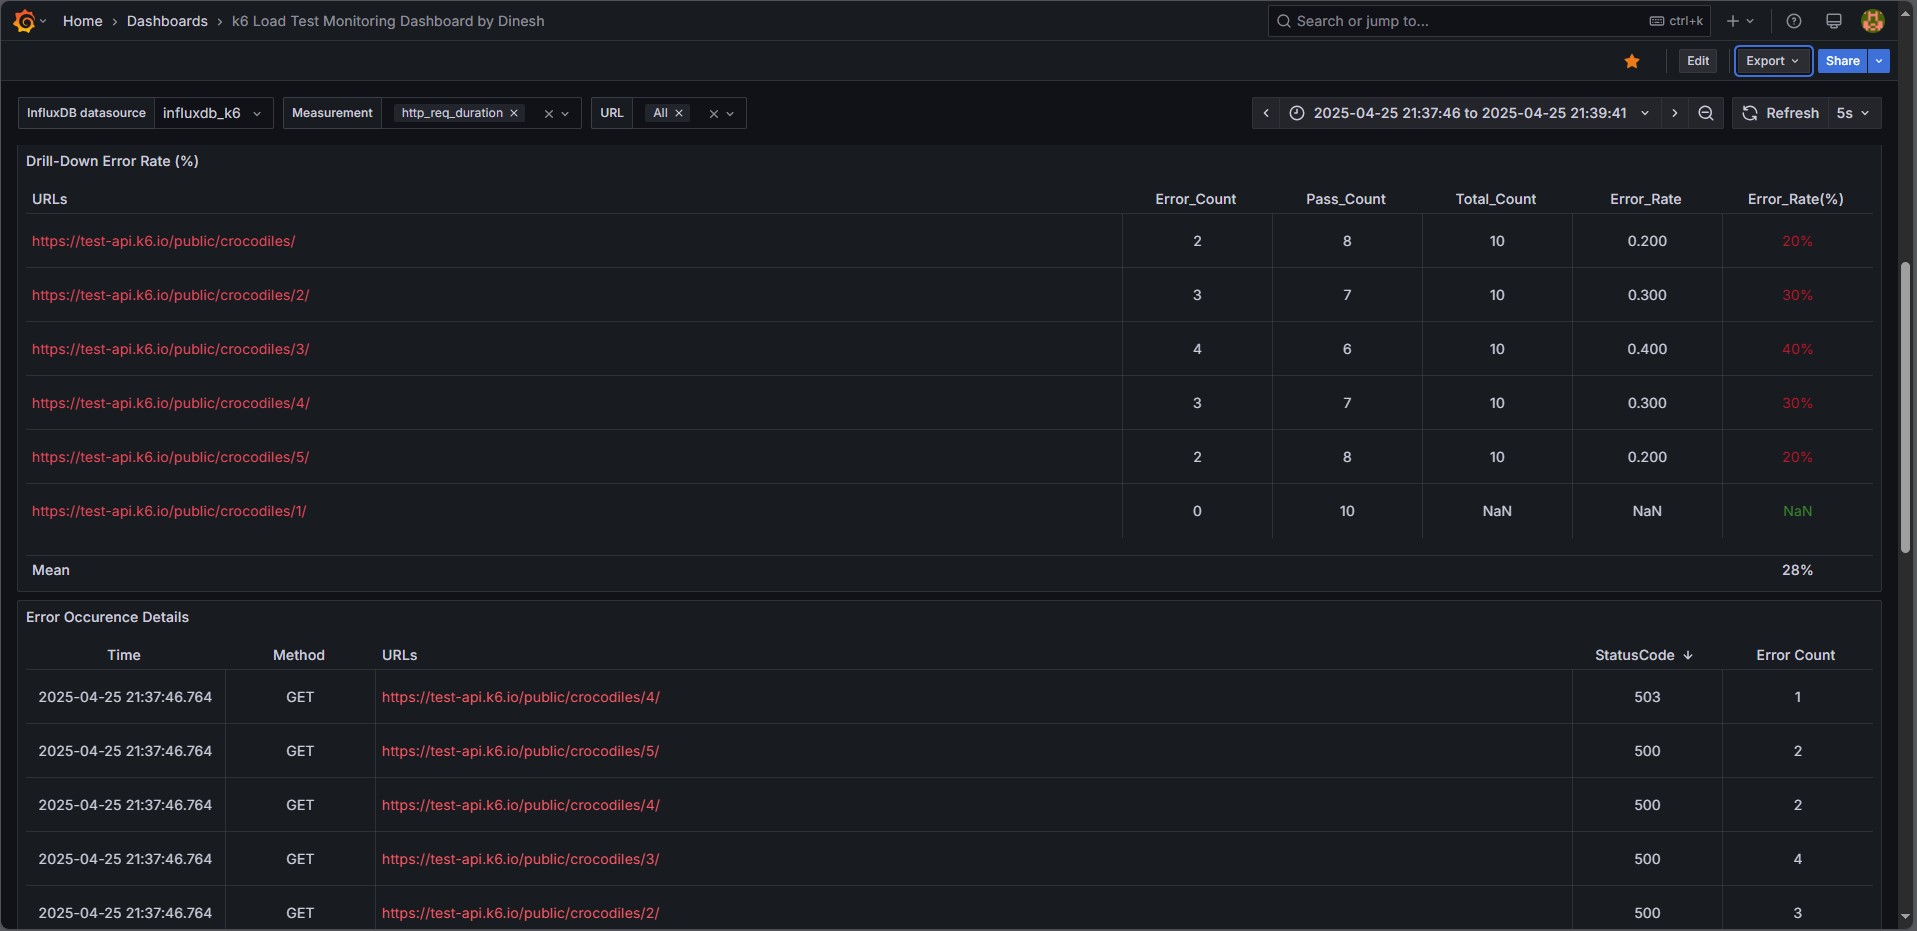
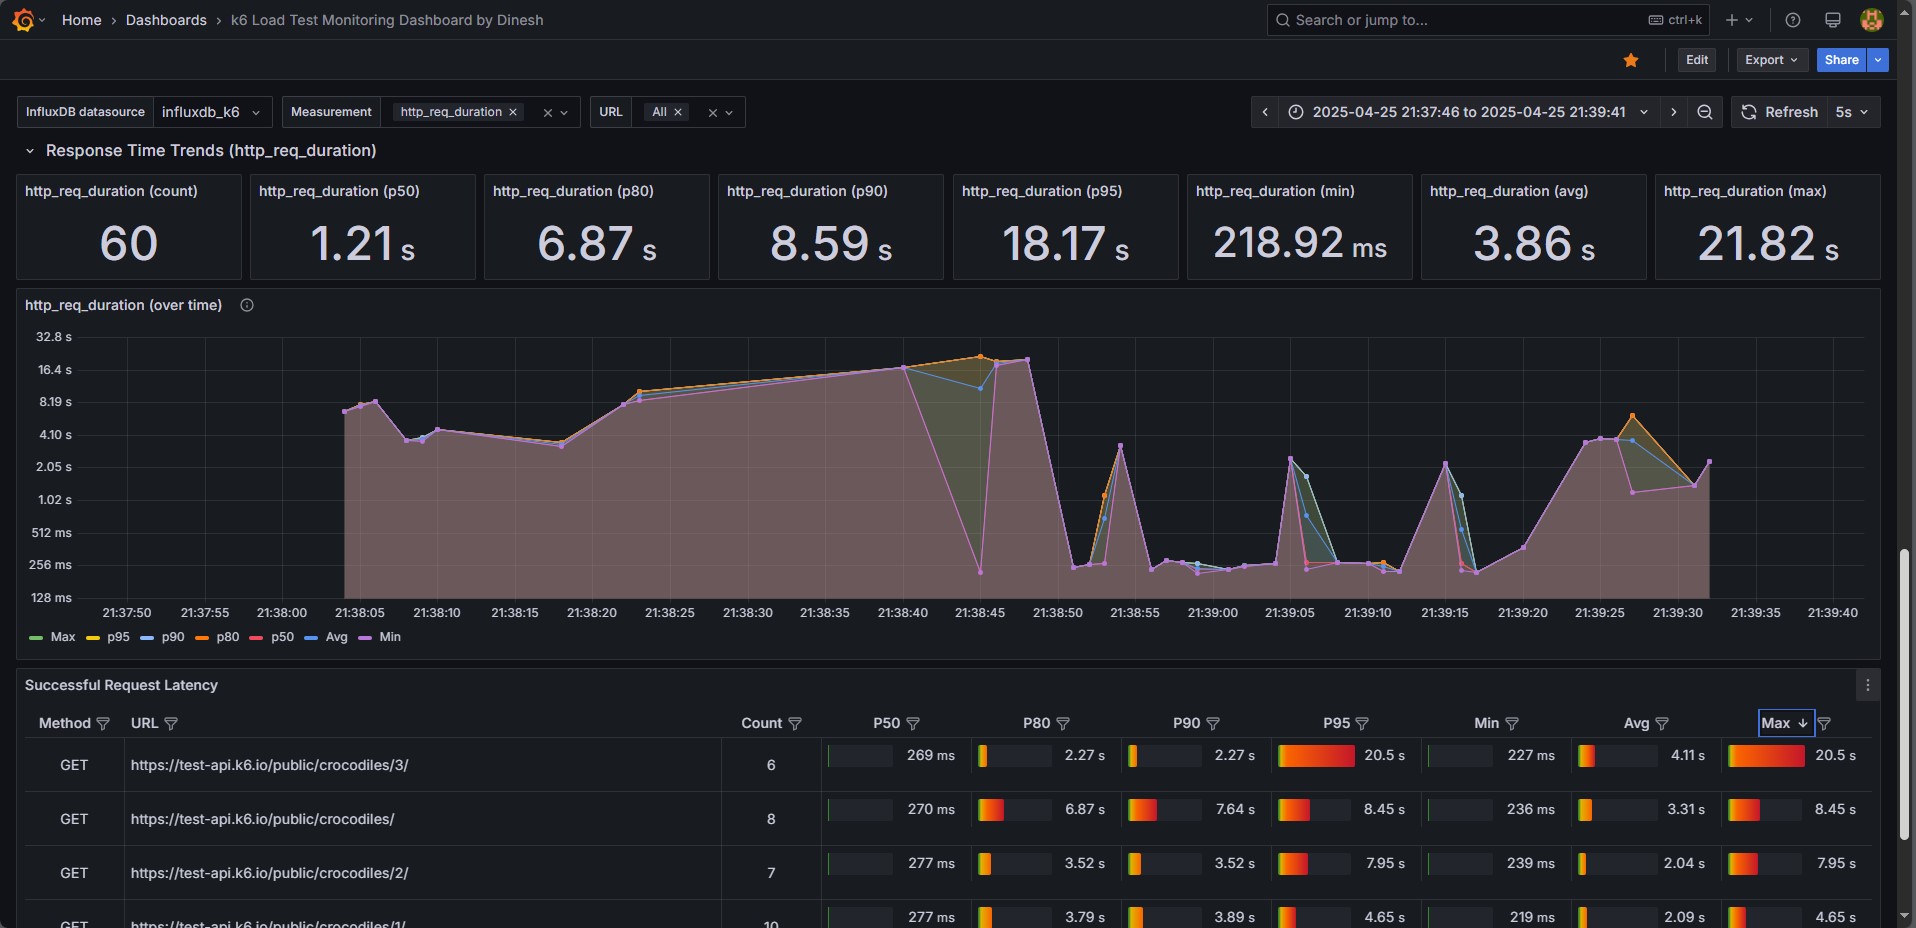
🔥 Next-Level Performance Observability with k6 + InfluxDB 1.x + Grafana 🔥 I built a powerful Grafana dashboard tailored for k6 performance testing, seamlessly integrating with the InfluxDB Exporter (v1.x). This dashboard delivers real-time, actionable KPIs—latency trends, request rates, error breakdowns, and more—to help teams zero in on performance bottlenecks instantly.
Whether you're running local stress tests or scaling up for CI/CD pipelines, this dashboard turns raw metrics into clean, intuitive visuals that empower you to make data-driven performance decisions with confidence. No more guesswork. Just insights that matter.
💡 Built for performance engineers who demand clarity, speed, and precision.
Data source config
Collector config:
Upload an updated version of an exported dashboard.json file from Grafana
| Revision | Description | Created | |
|---|---|---|---|
| Download |