JMeter and Telegraf Data Dashboard
This Dashhboard visualises basic Telegraf System Data (Plugins: System, cpu, mem, net) combined with JMeter Data, which is collected by the influxDB-Listener. All Data is stored in a single Bucket.
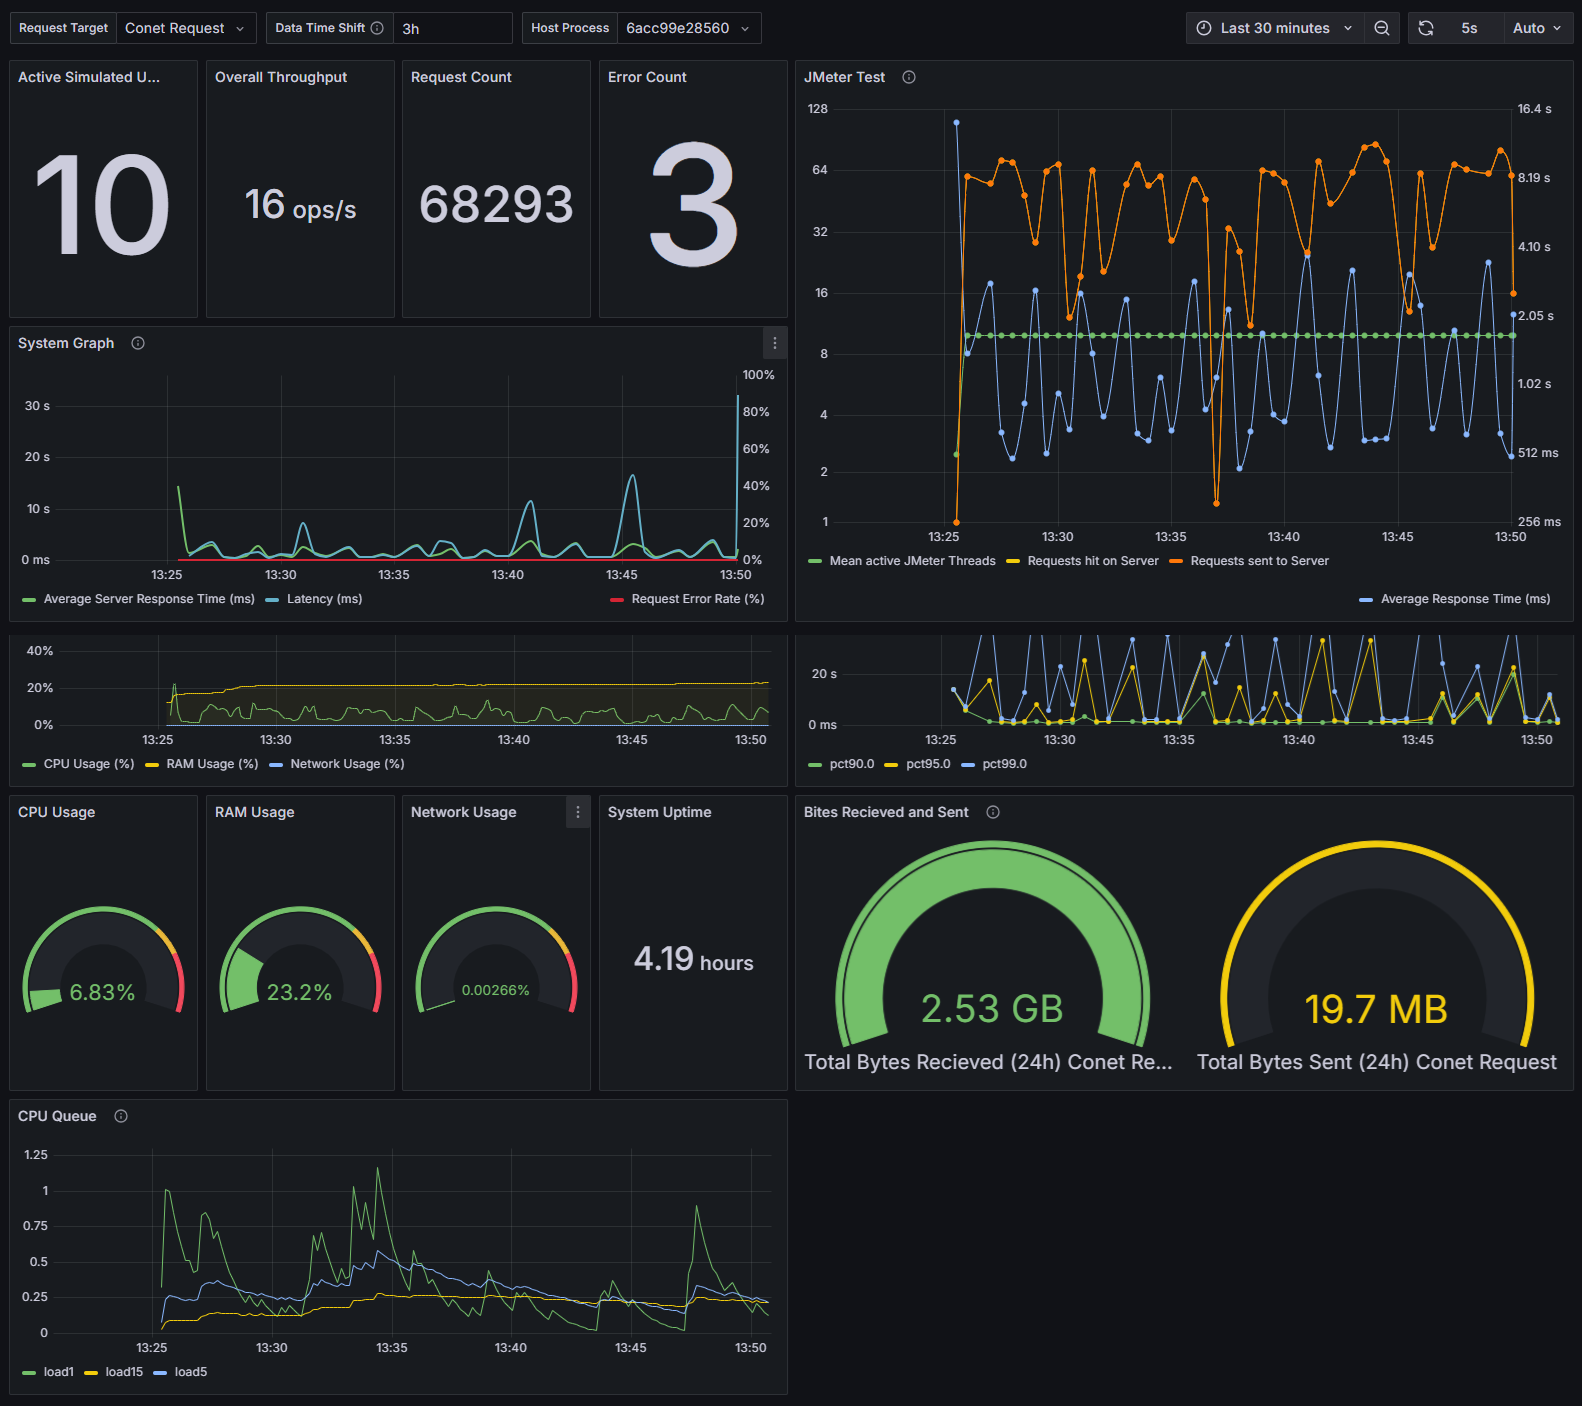
The JMeter and Telegraf Data Dashboard dashboard uses the influxdb data source to create a Grafana dashboard with the gauge, stat and timeseries panels.
Data source config
Collector type:
Collector plugins:
Collector config:
Revisions
Upload an updated version of an exported dashboard.json file from Grafana
| Revision | Description | Created | |
|---|---|---|---|
| Download |