NTFY InfluxDB
NTFY Dashboard written in Flux
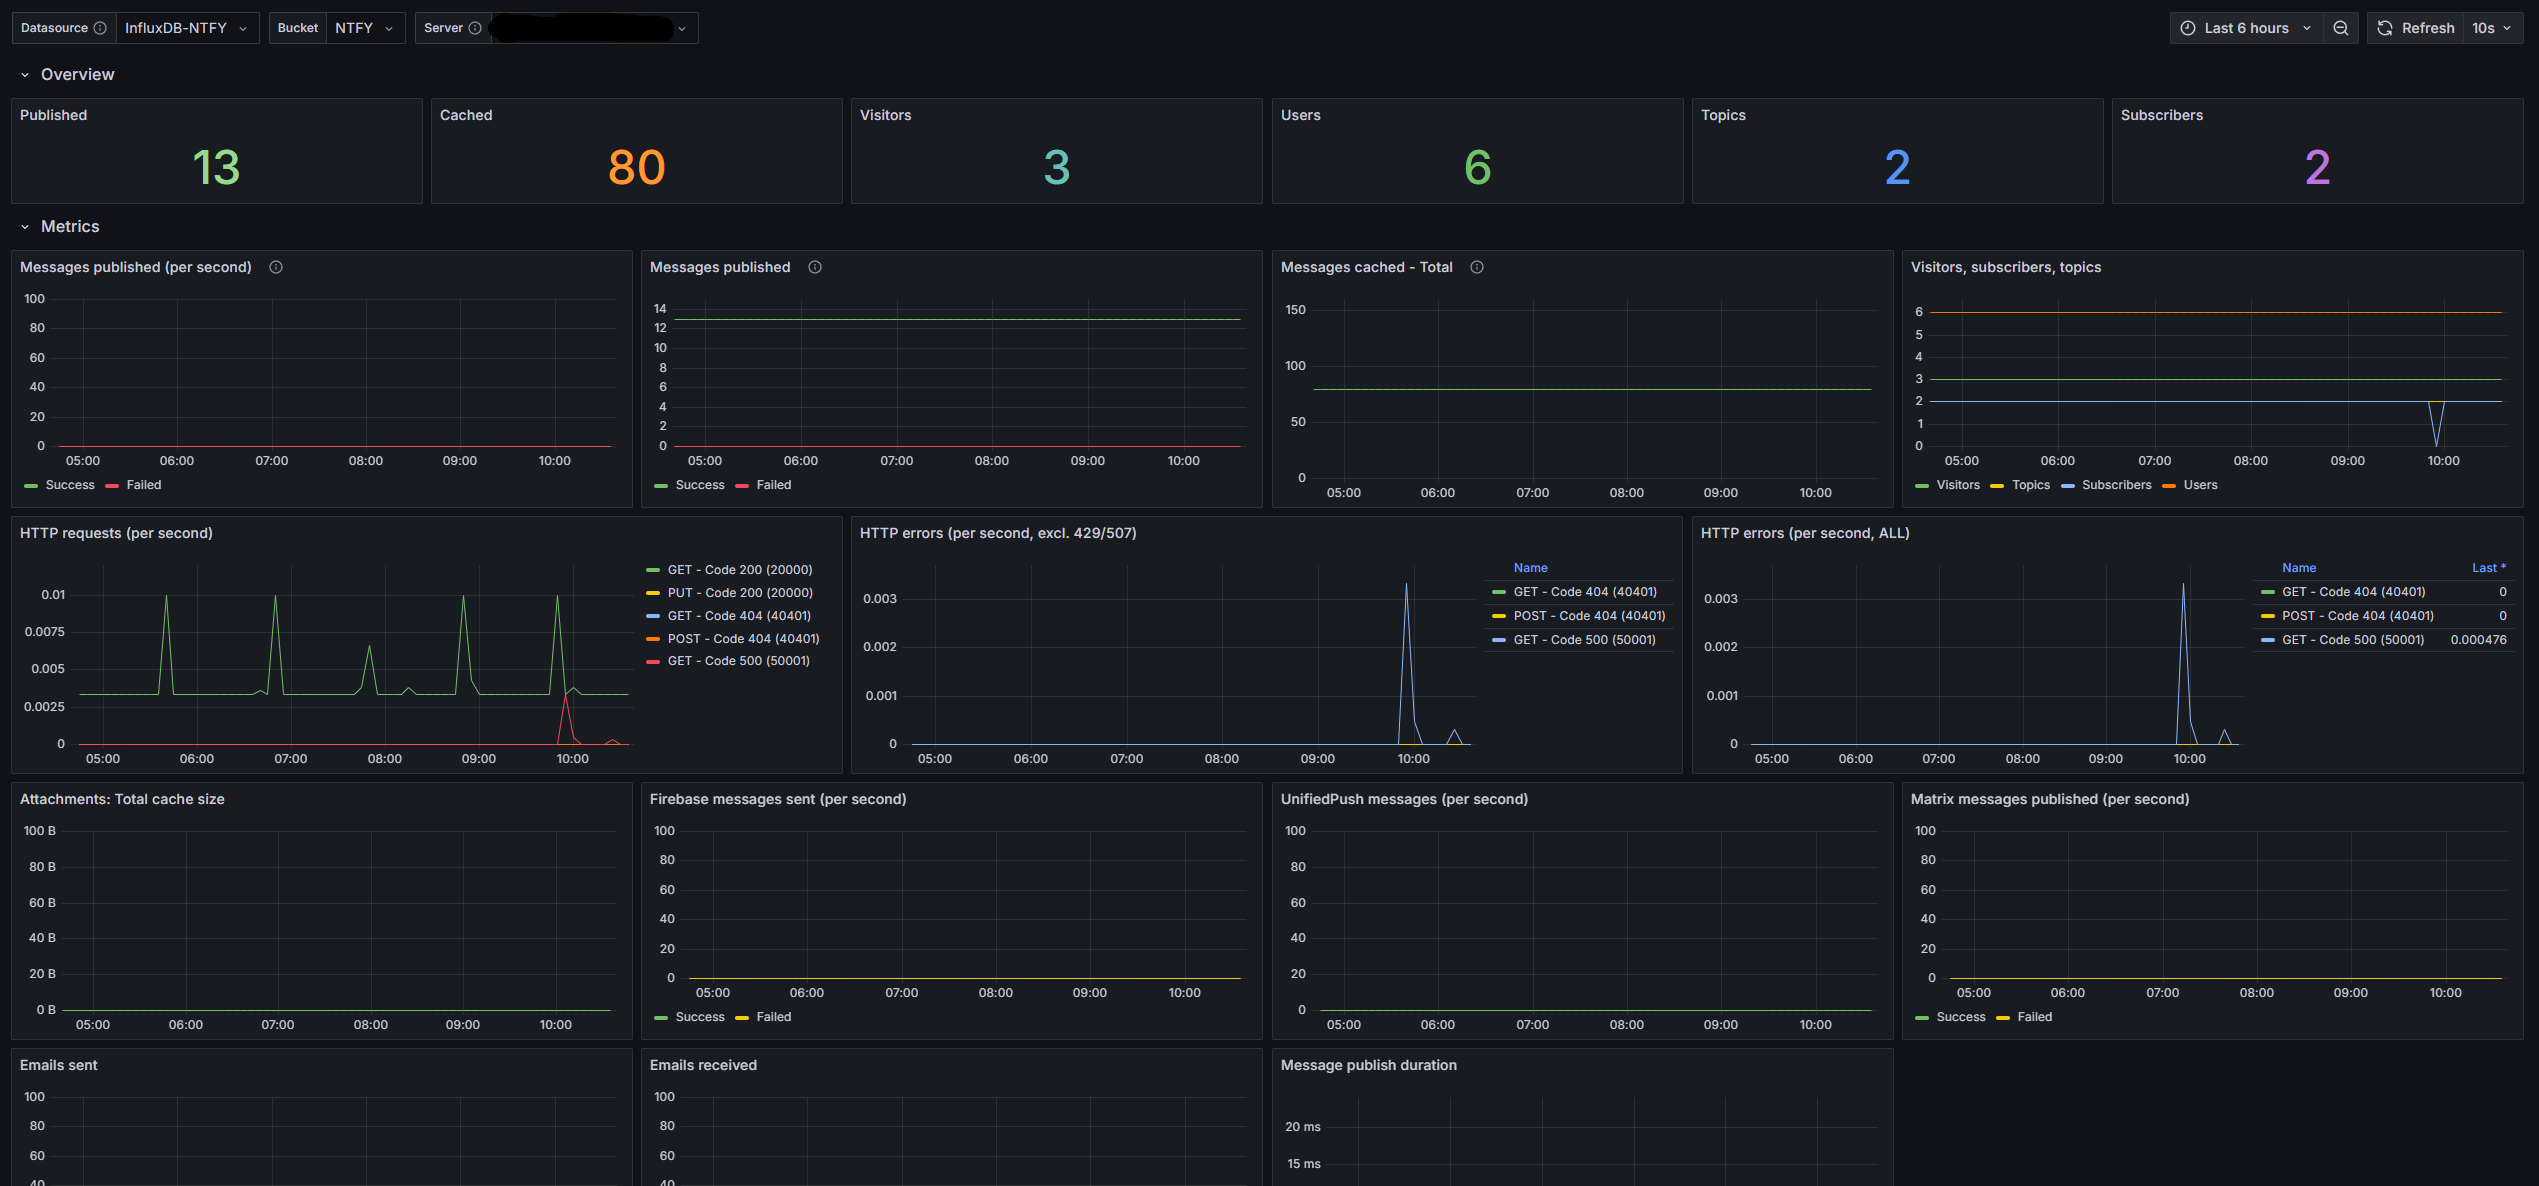
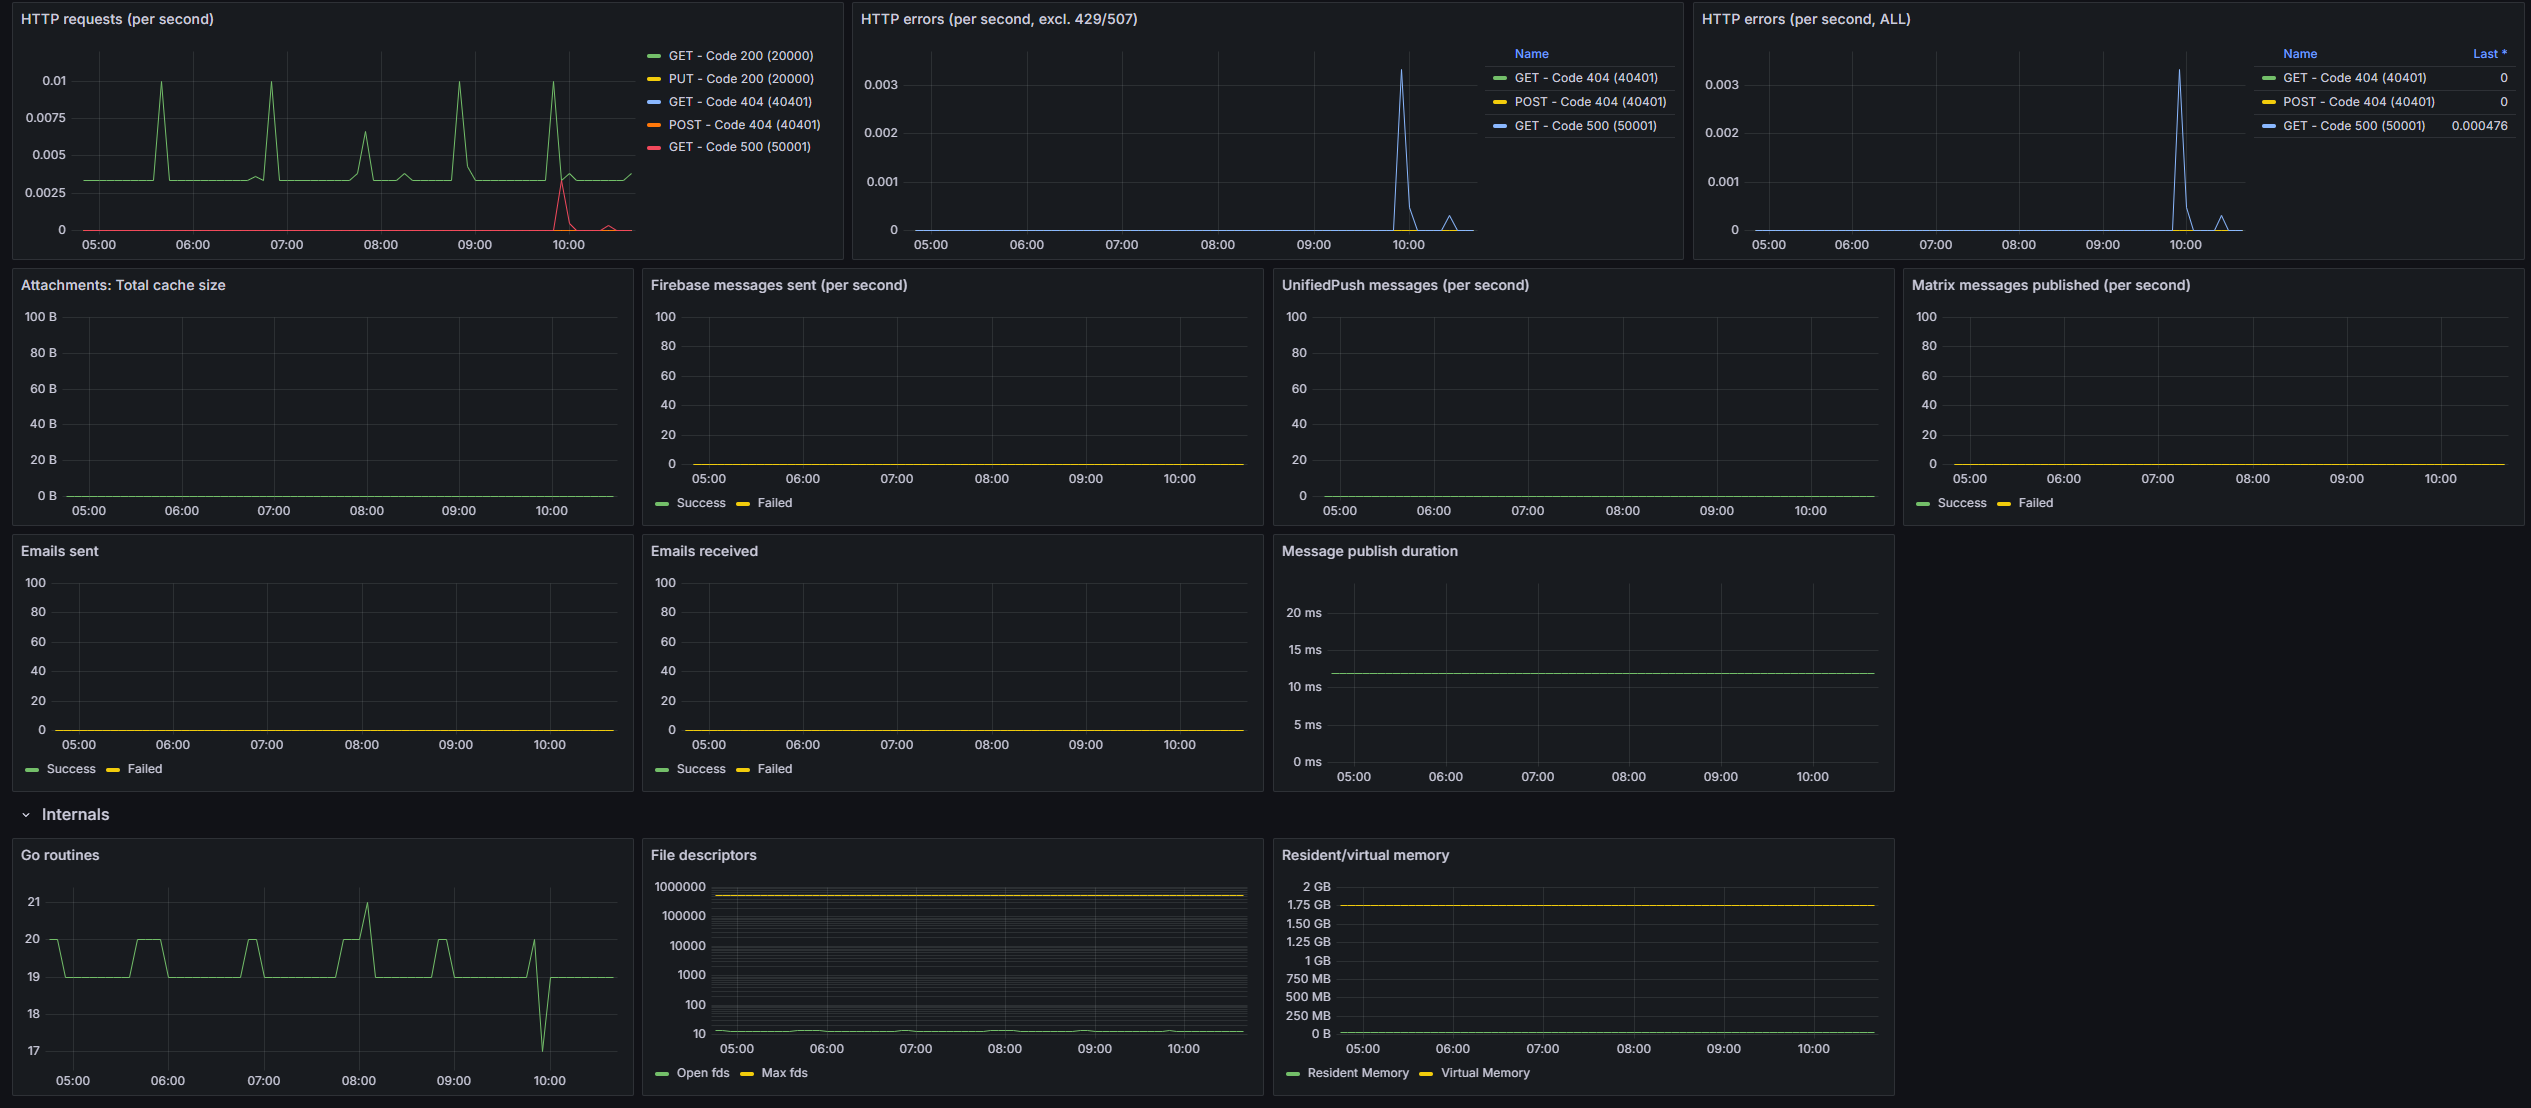
A useful and easy to setup dashboard for NTFY. The original dashboard mentioned in the NTFY docs had some bugs and was rather outdated. I used this and converted it from Prometheus to InfluxDB2.
Instructions:
- Enable metrics in the NTFY server (see docs for more info).
- Create a Bucket InfluxDB2. (No need to save the token, we won't use it).
- There were a few options for this step, but ultimately the prometheus.scrape method was fastest + easiest to set up and super reliable. To use this method, first create a task in InfluxDB
- Give it a name.
- Set the scrape time.
- Paste the following in the task contents
import "experimental/prometheus"prometheus.scrape(url: "http://example.com/metrics") |> to(bucket: "example-bucket")
- Change the URL to your NTFY server.
- Change the bucket name to the bucket you created in Step 2.
- Save the task.
- Verify data is being stored in the bucket. (You can force run the task a few times if your impatient like me or if your delay is too long)
- Create an InfluxDB Custom API token for Grafana with read privileges to the bucket. Copy the token.
- Add InfluxDB2 data source as described in this Grafana docker-compose guide. (Adding a default bucket in Grafana is optional).
- Import this dashboard and set the appropriate Datasource, Bucket and Server.
Data source config
Collector type:
Collector plugins:
Collector config:
Revisions
Upload an updated version of an exported dashboard.json file from Grafana
| Revision | Description | Created | |
|---|---|---|---|
| Download |
InfluxDB
Easily monitor InfluxDB, an open source time series database, with Grafana Cloud's out-of-the-box monitoring solution.
Learn more