Proxmox 7/8 InfluxDB2
Proxmox Dashboard complete written in Flux
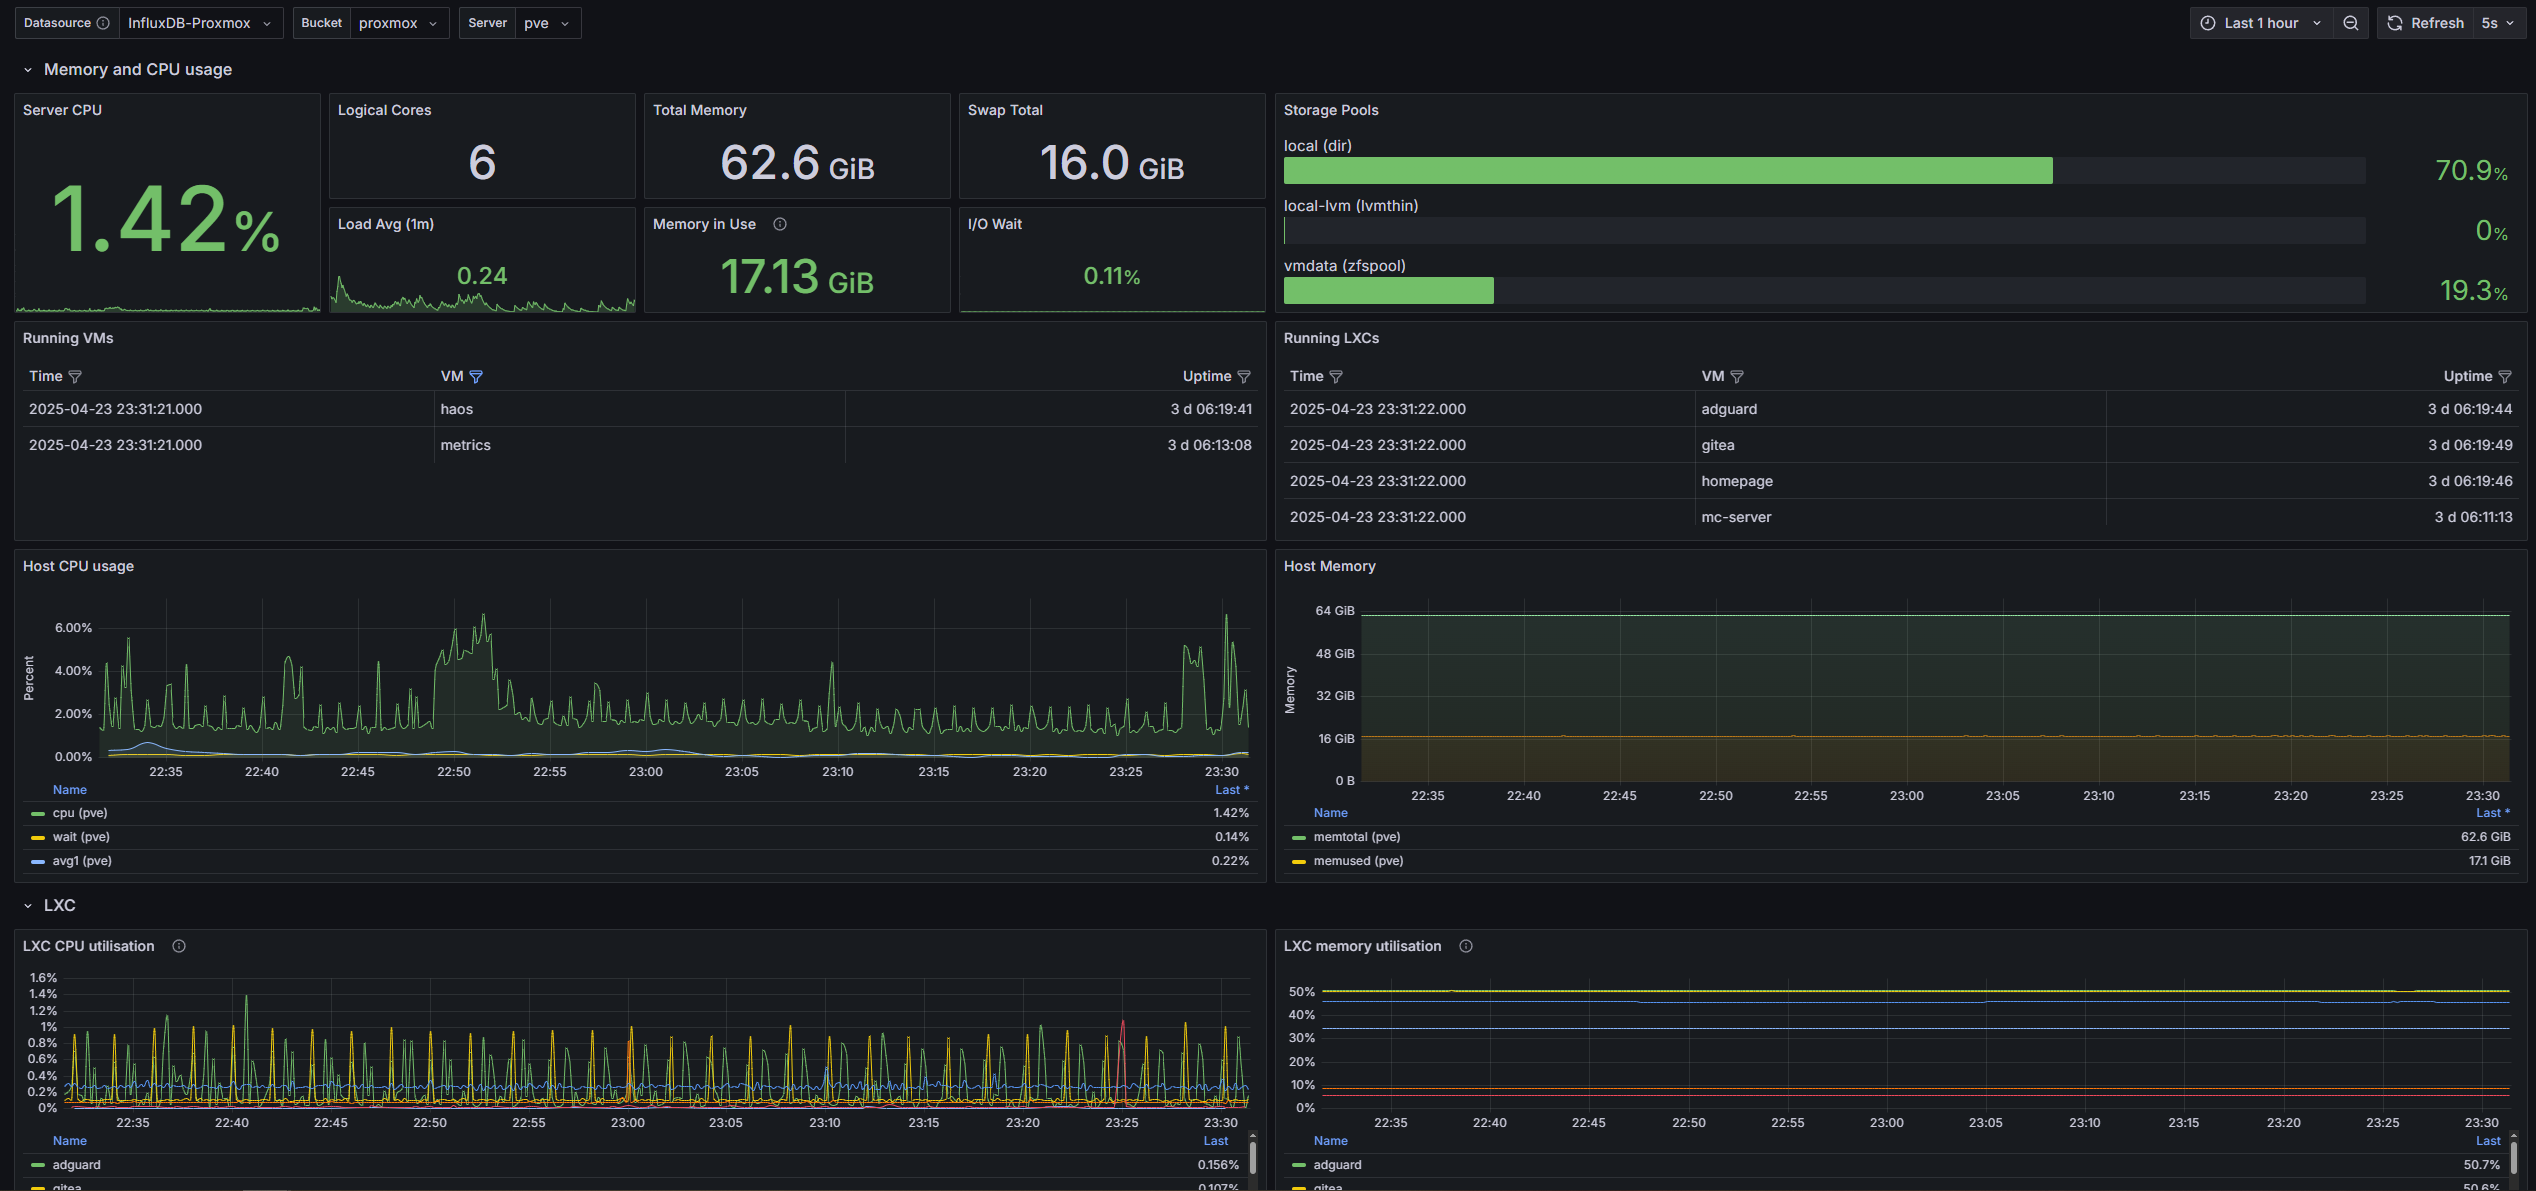
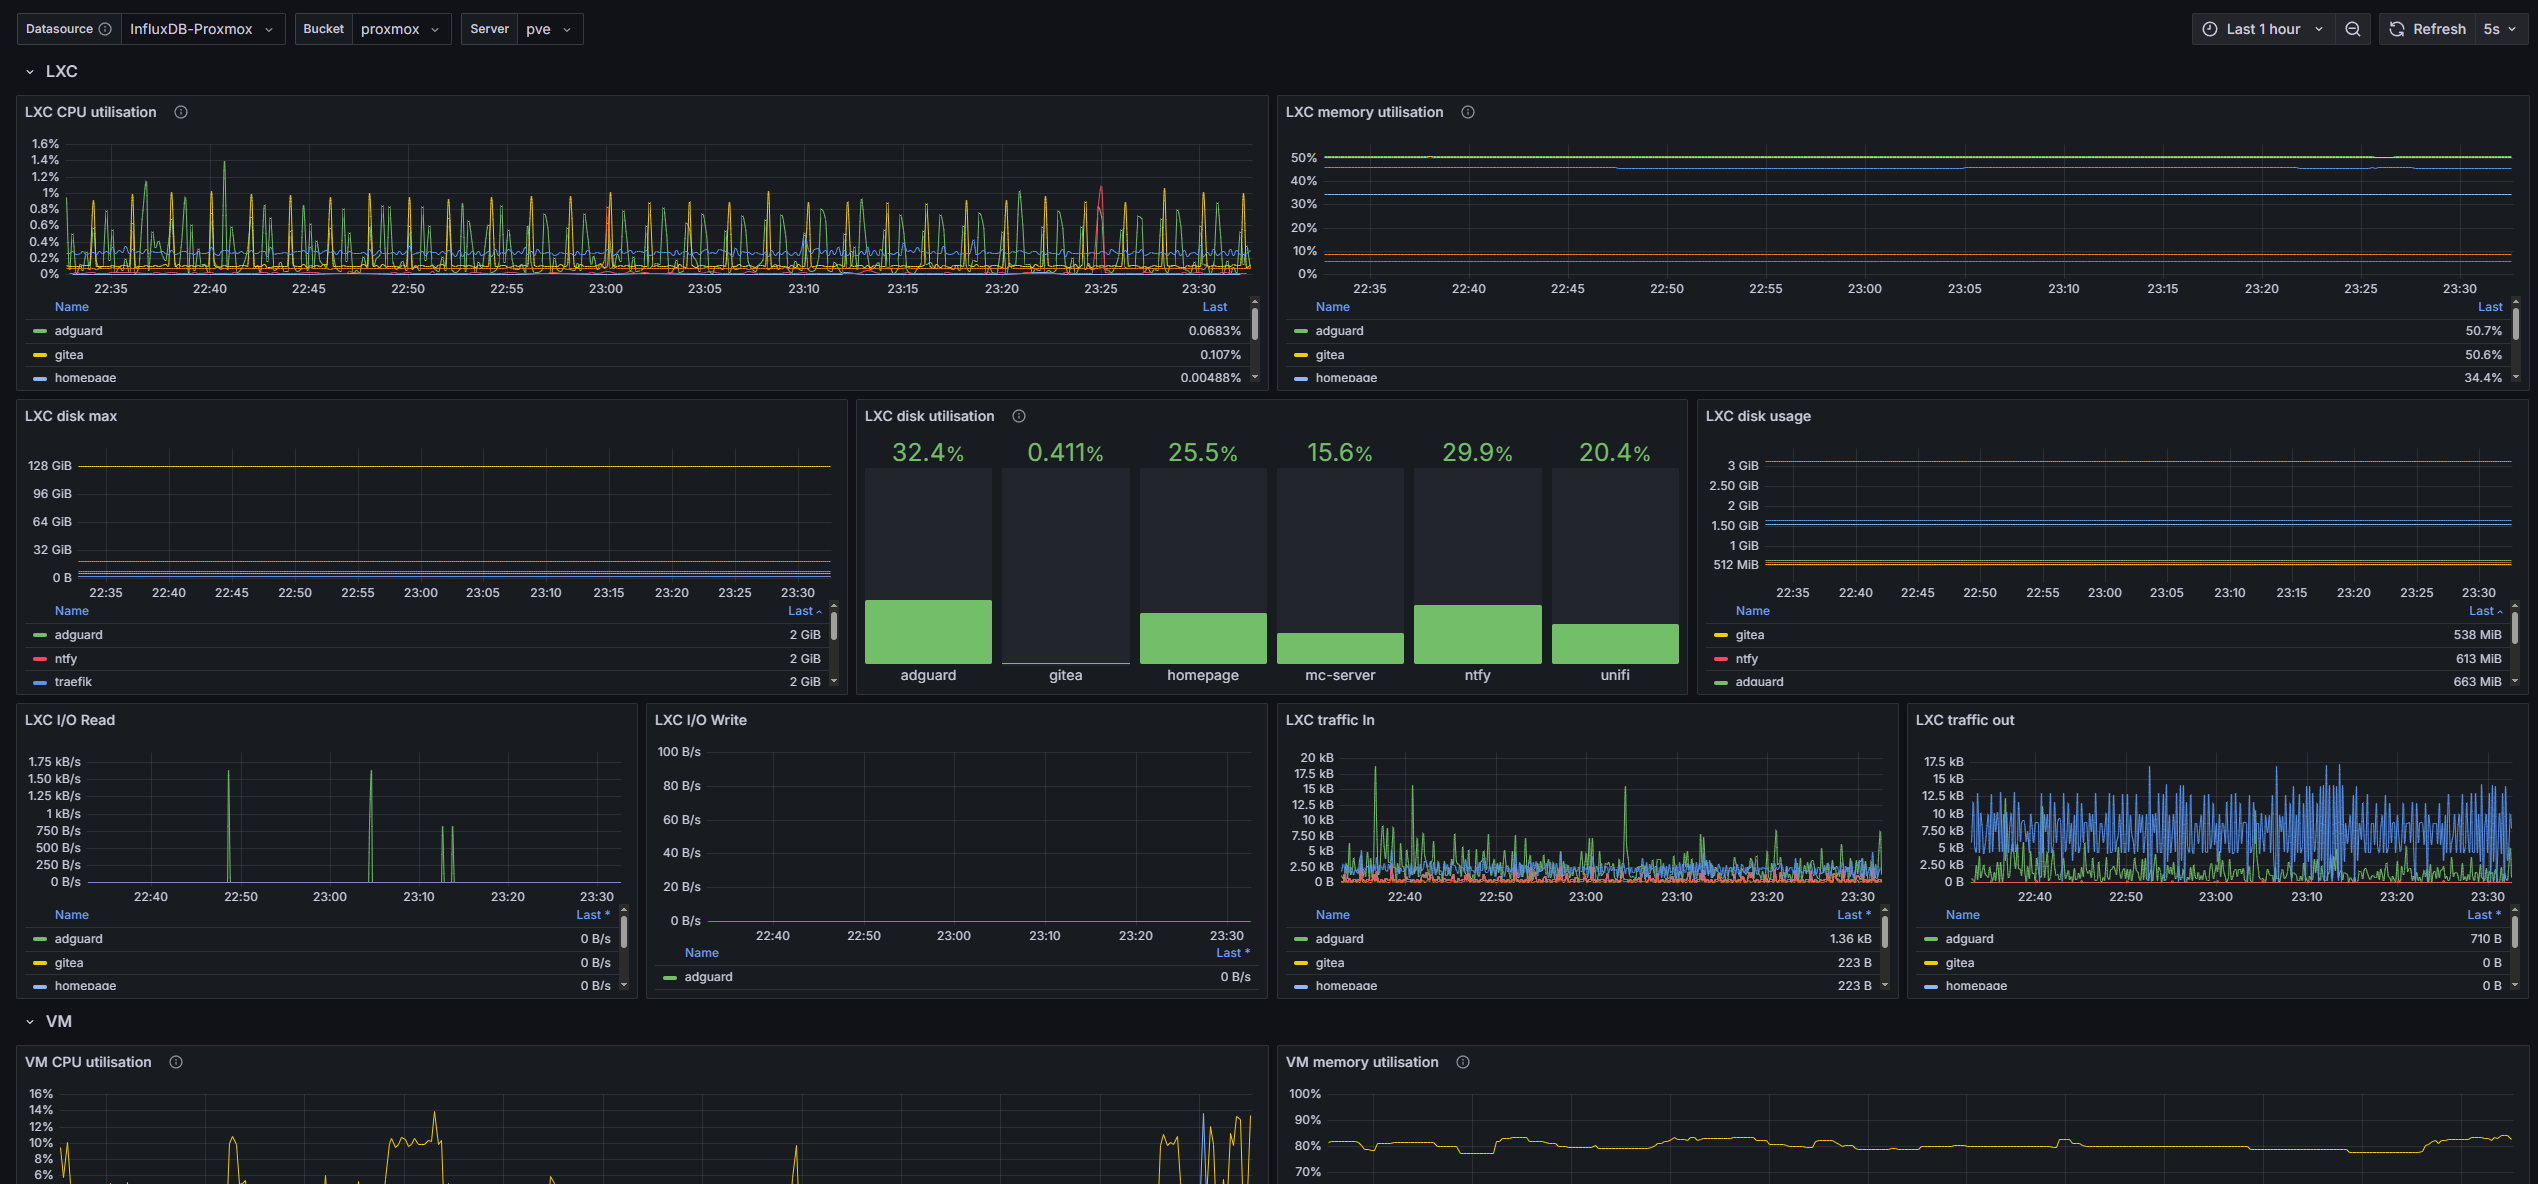
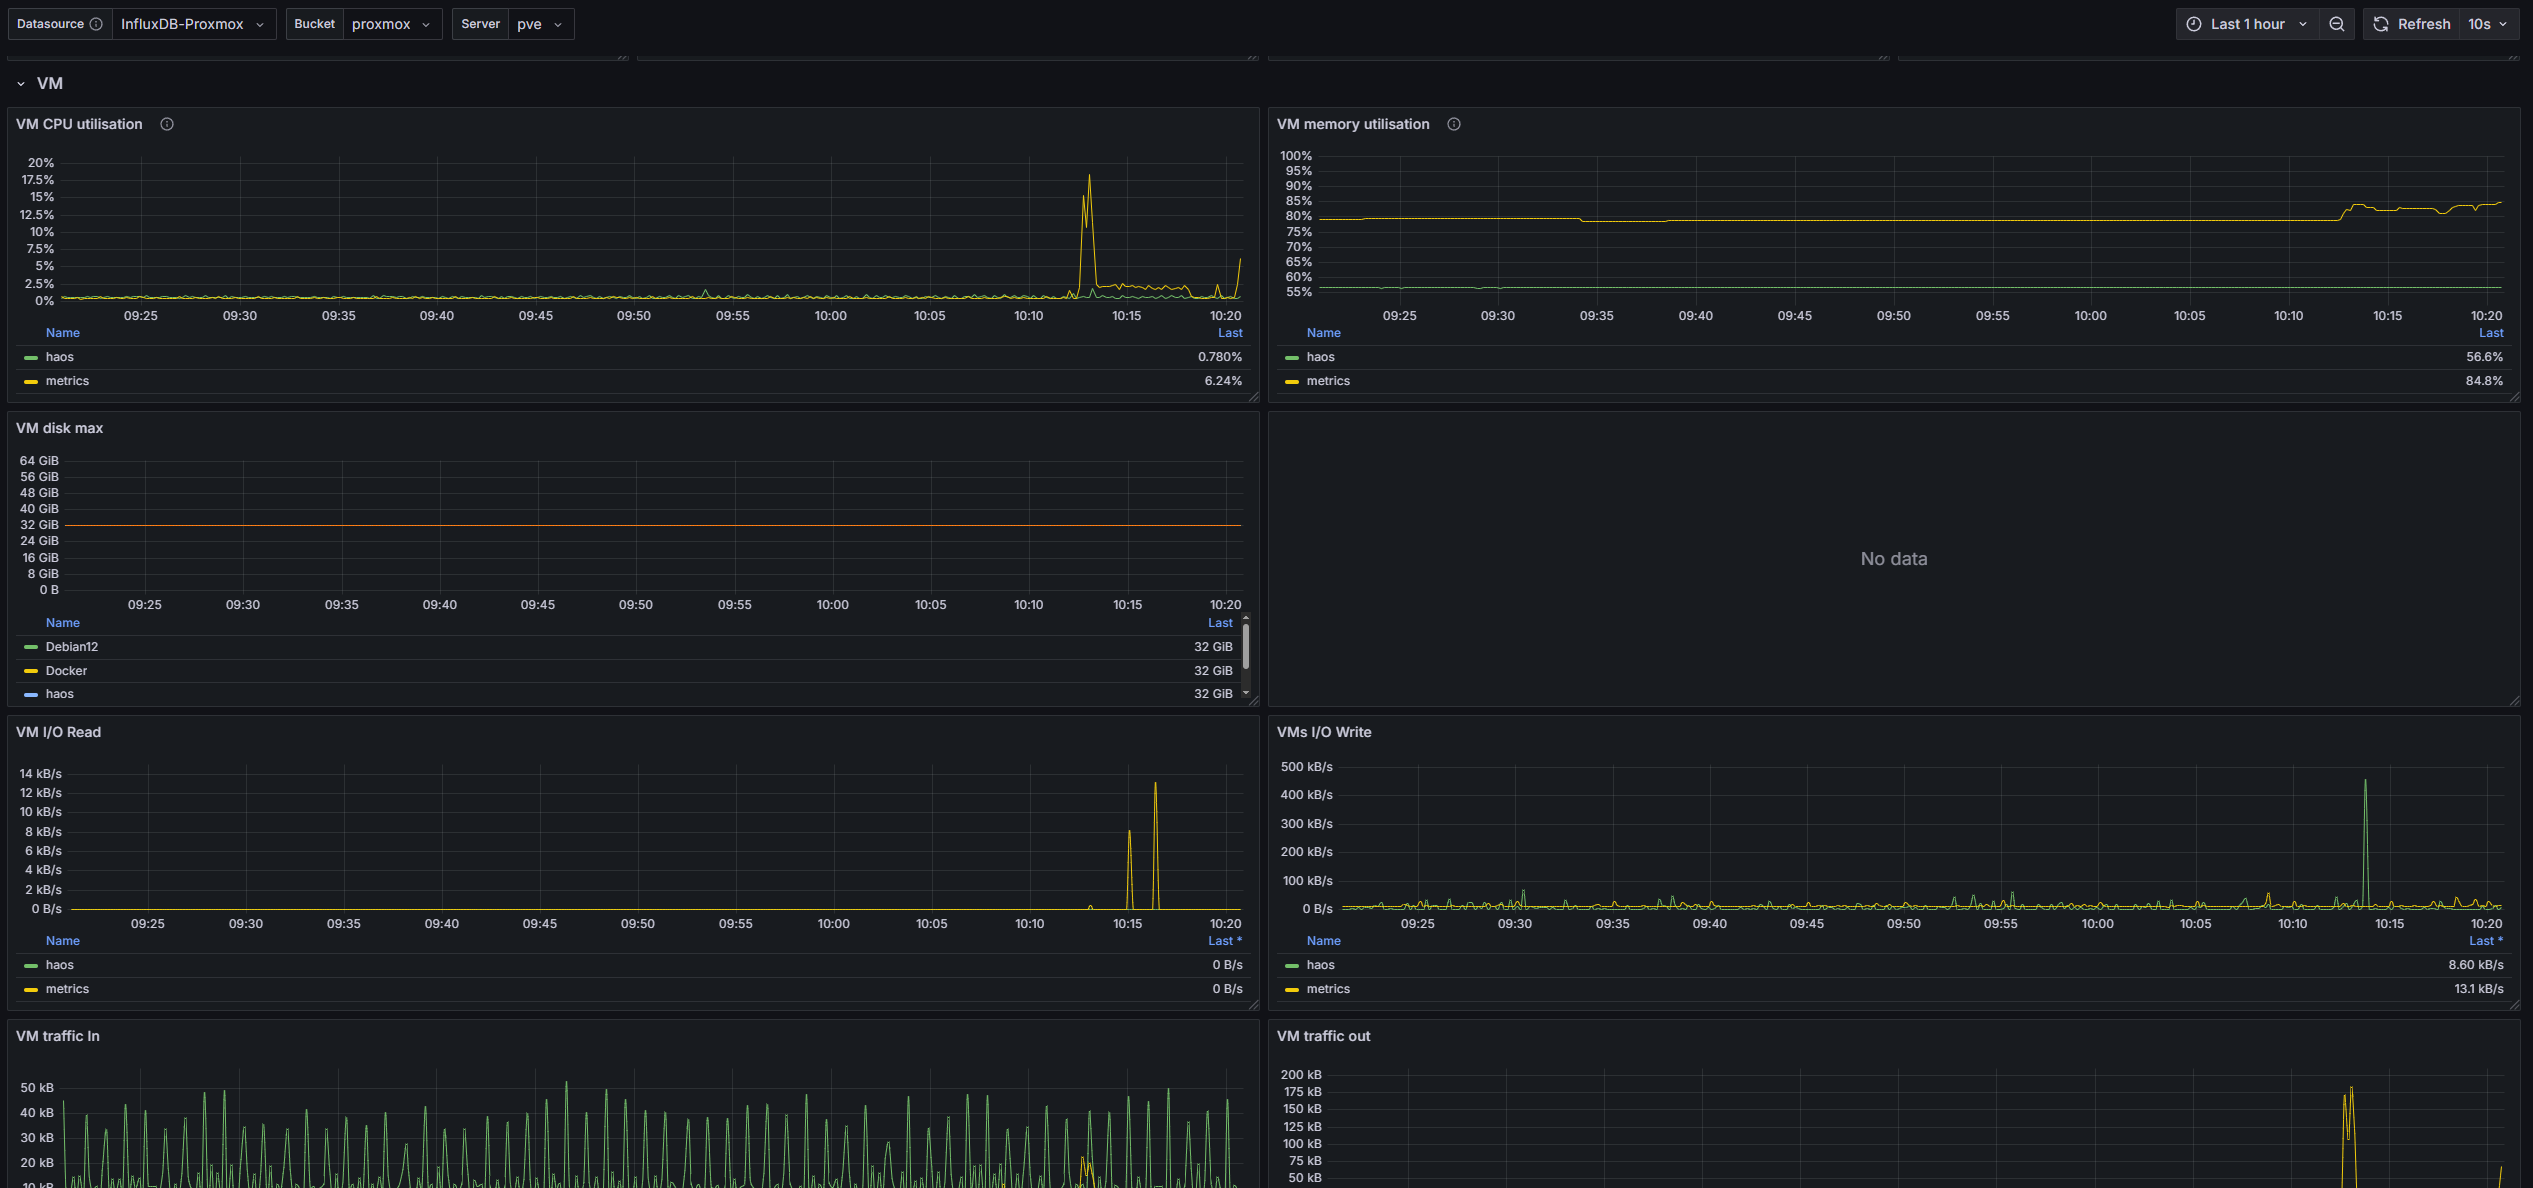
Originally from mephisto and christiangursky -- I tweaked some settings and improved readability of the host CPU and host Memory graph. It is intended for use with an InfluxDB2 database. I can confirm this works on Proxmox 8, it should also work on Proxmox 7.
It's easy to setup:
- Create a Bucket + Token in InfluxDB2. Copy the token.
- Enable metrics in Proxmox VE.
- Verify that data is being stored in the InfluxDB bucket (via Data Explorer).
- Create an InfluxDB Custom API token for Grafana with read privileges to the bucket. Copy the token.
- Add InfluxDB2 data source as described in this Grafana docker-compose guide.
- Import this dashboard and set the appropriate data source.
Note: For new installations, step 1 is done as part of the initialisation process of InfluxDB2.
Check this Proxmox Grafana Guide for more detailed explanations.
Shoutout to htpcbeginner for the detailed setup instructions.
Data source config
Collector type:
Collector plugins:
Collector config:
Revisions
Upload an updated version of an exported dashboard.json file from Grafana
| Revision | Description | Created | |
|---|---|---|---|
| Download |