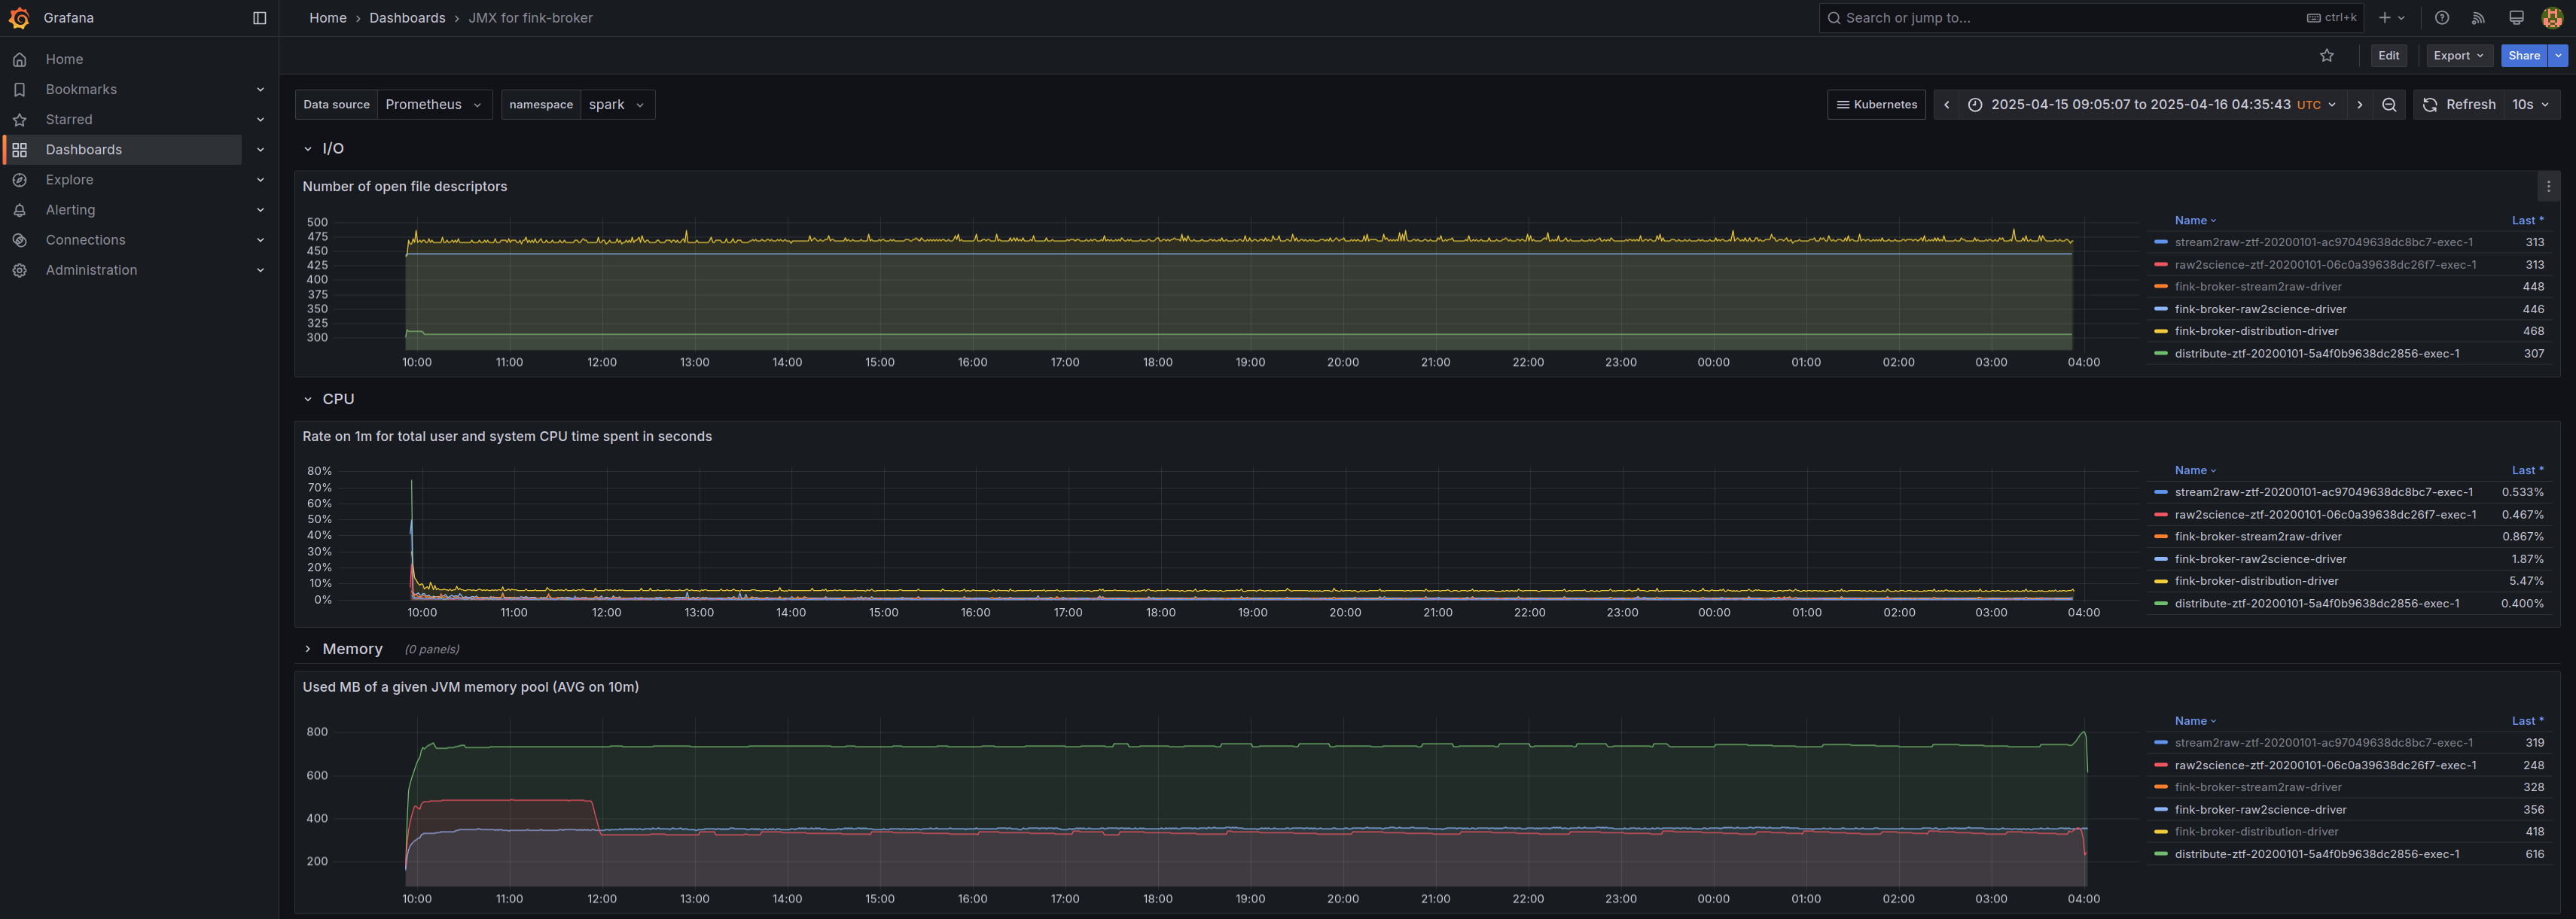
Apache Spark JMX Metrics Dashboard for Kubernetes
This Grafana dashboard visualizes JMX metrics from Apache Spark pods running in a Kubernetes cluster. It provides real-time insights into executor and driver performance, memory usage, garbage collection, thread activity, and job statistics. Ideal for Spark operators and engineers to monitor application health and optimize resource usage.
Display all Spark pods within a specified namespace. For each pod, retrieve and display the following metrics:
CPU and memory usage
Number of open file descriptors
Heap and non-heap memory usage
Garbage Collection (GC) statistics
Number of loaded Java classes
Data source config
Collector config:
Upload an updated version of an exported dashboard.json file from Grafana
| Revision | Description | Created | |
|---|---|---|---|
| Download |
Kubernetes
Monitor your Kubernetes deployment with prebuilt visualizations that allow you to drill down from a high-level cluster overview to pod-specific details in minutes.
Learn more