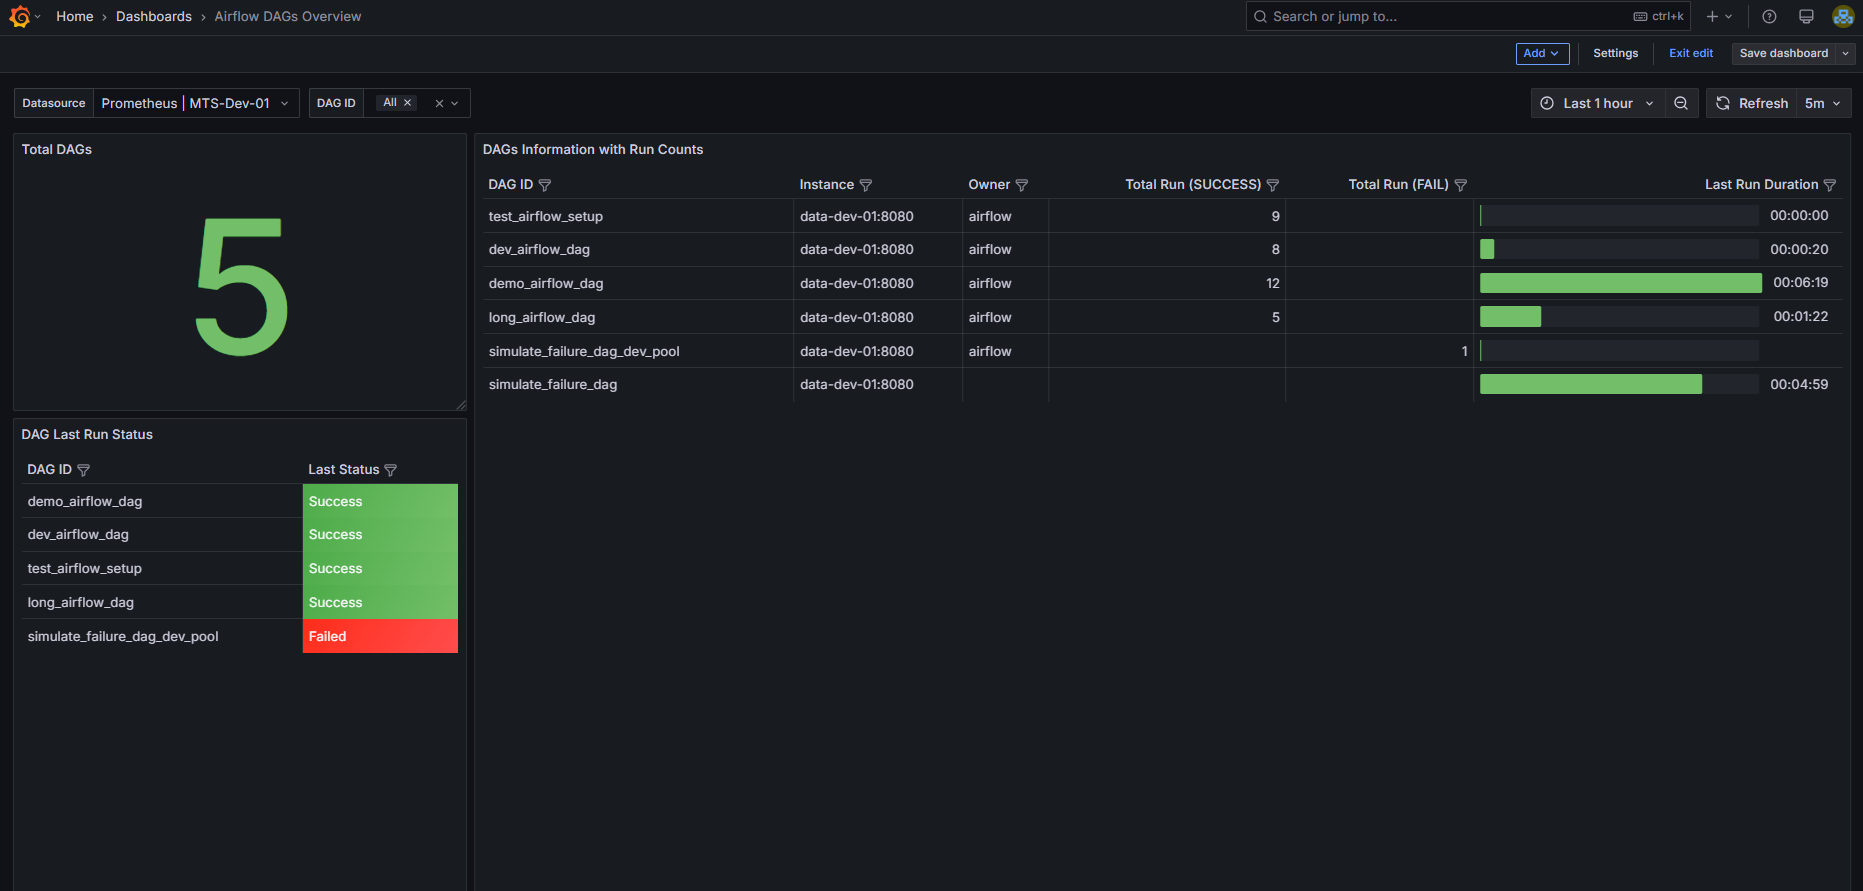
Airflow DAGs Overview
A simple dashboard to monitor Apache Airflow DAGs — track total DAGs, last run status, execution durations, and success/failure trends across instances.
Exporting Metrics from Airflow
This dashboard uses the airflow-exporter to expose Airflow metrics to Prometheus. It collects DAG run data, task statuses, durations, and other runtime metrics for visualization in Grafana.
For setup and configuration, refer to the official documentation: https://pypi.org/project/airflow-exporter/
Data source config
Collector type:
Collector plugins:
Collector config:
Revisions
Upload an updated version of an exported dashboard.json file from Grafana
| Revision | Description | Created | |
|---|---|---|---|
| Download |
Apache Airflow
Easily monitor Apache Airflow, an open source platform for programmatically authoring, scheduling, and monitoring workflows, with Grafana Cloud's out-of-the-box monitoring solution.
Learn more