ClickHouse and Keeper Comprehensive Dashboard
ClickHouse internal exporter metrics
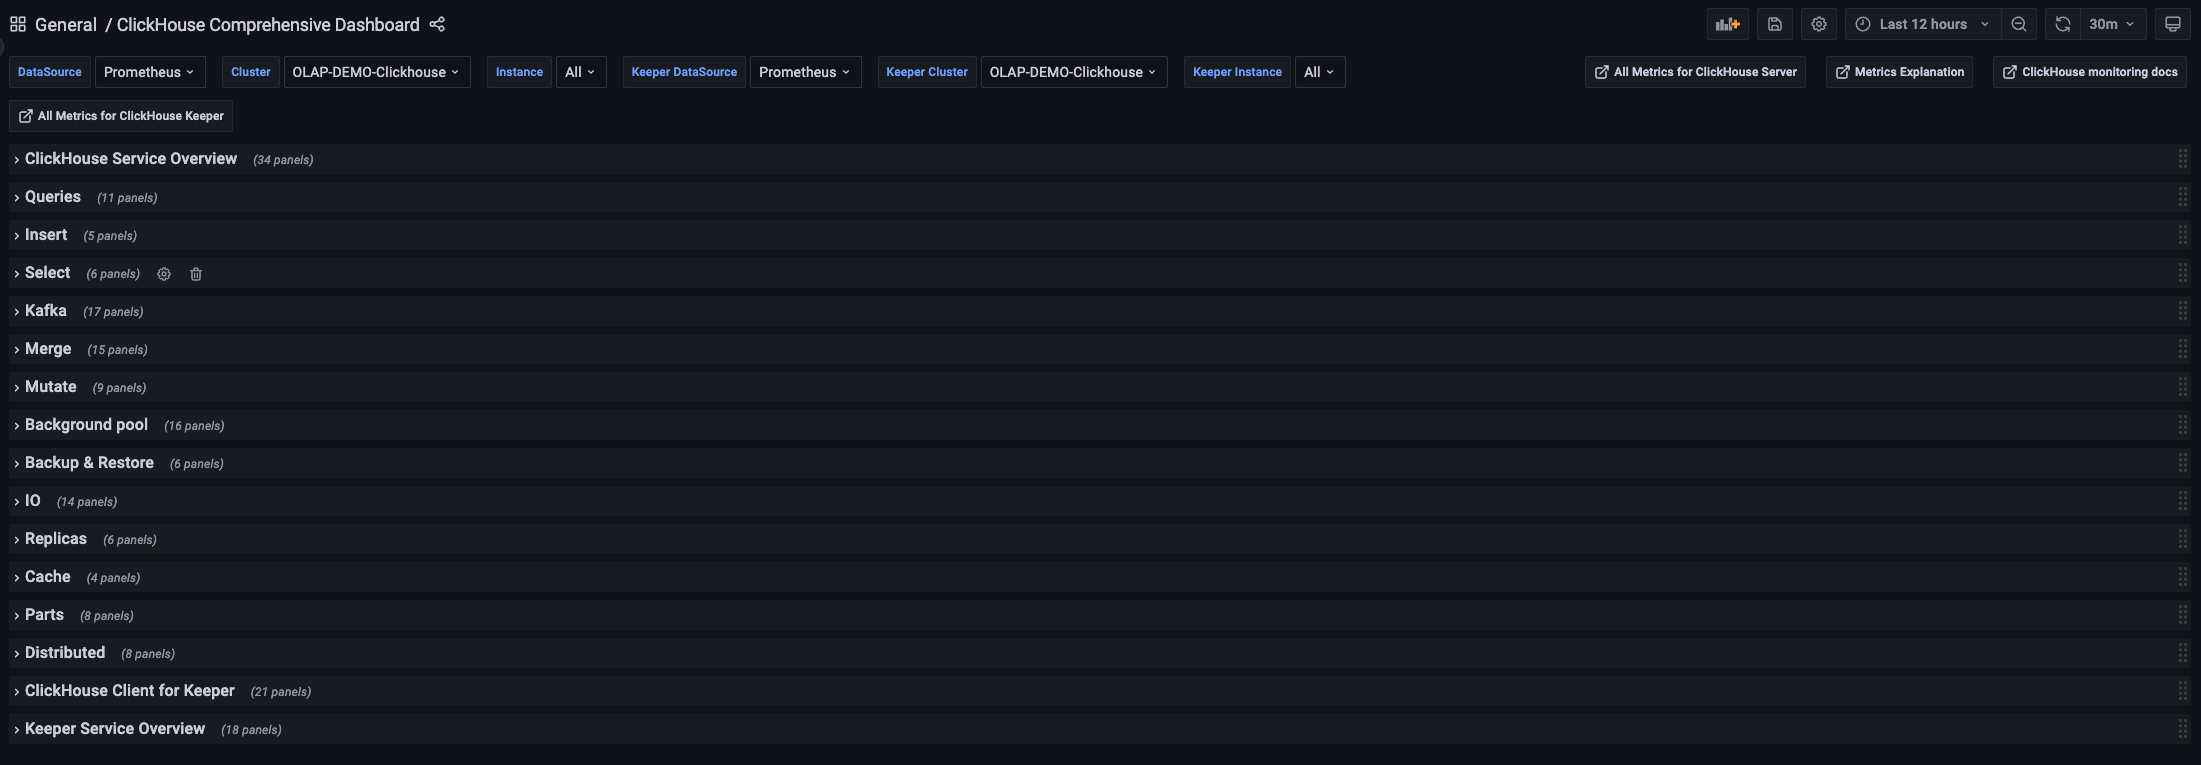
ClickHouse and Keeper Comprehensive Dashboard
✅ Overview
- This dashboard is designed to monitor and visualize ClickHouse server metrics, using Prometheus as the data source.
- It leverages ClickHouse’s internal /metrics endpoint to provide deep insights into system health, resource usage, and storage status.
✅ Key Features:
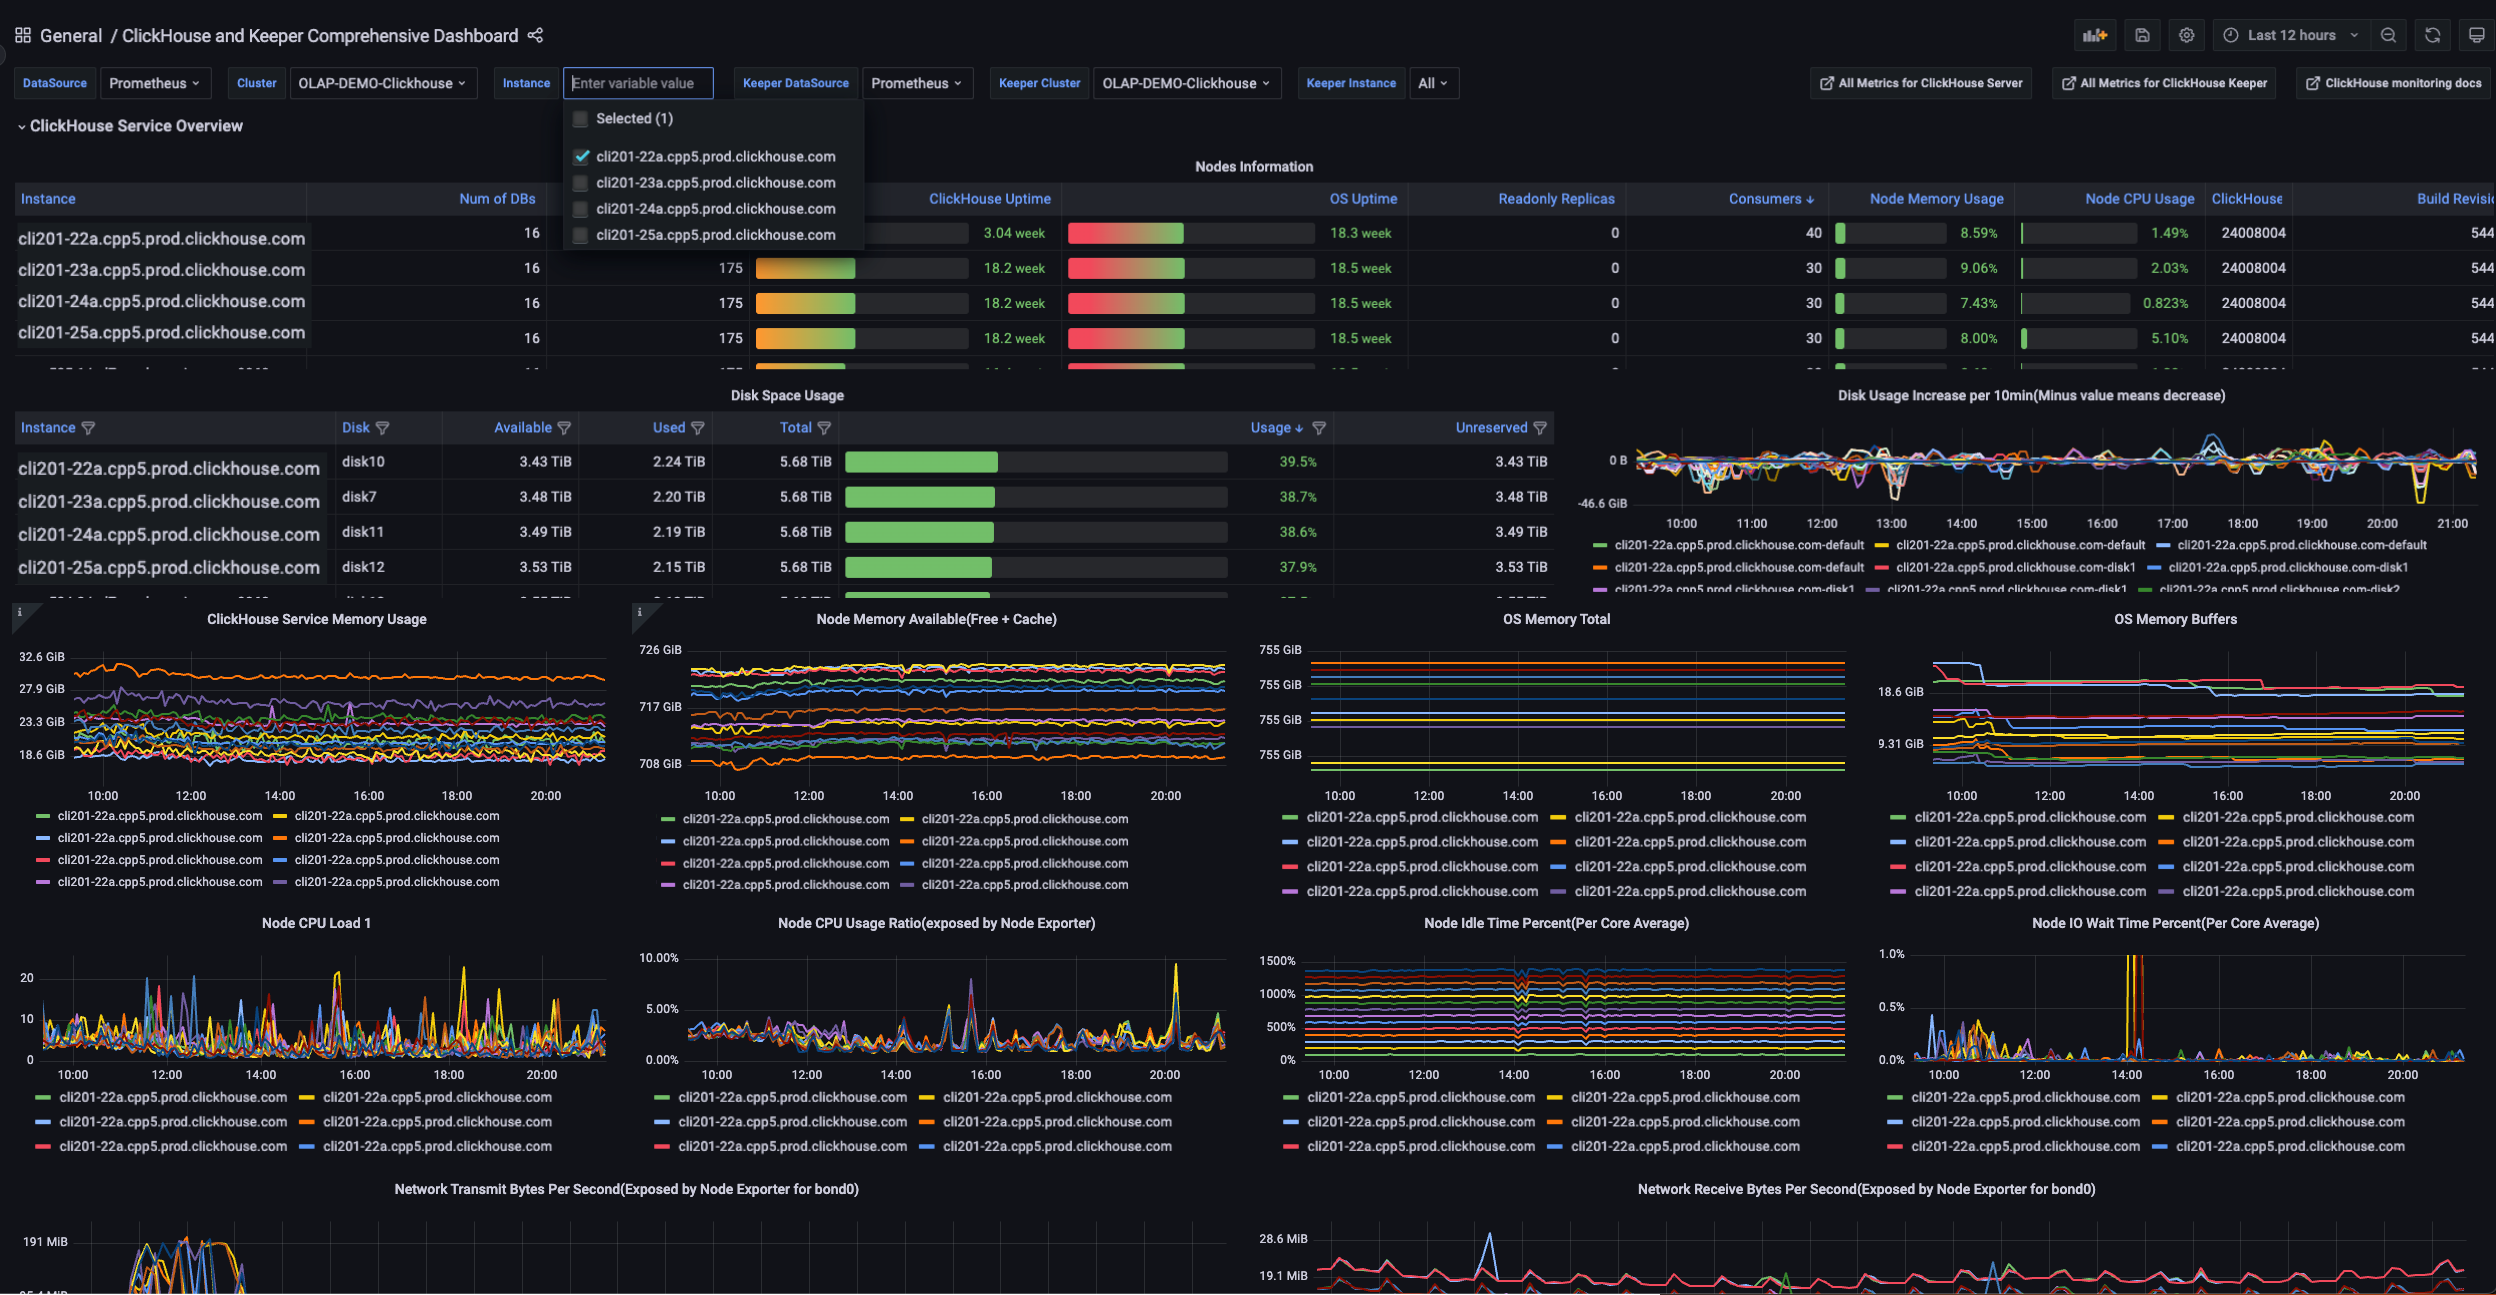
Cluster Overview
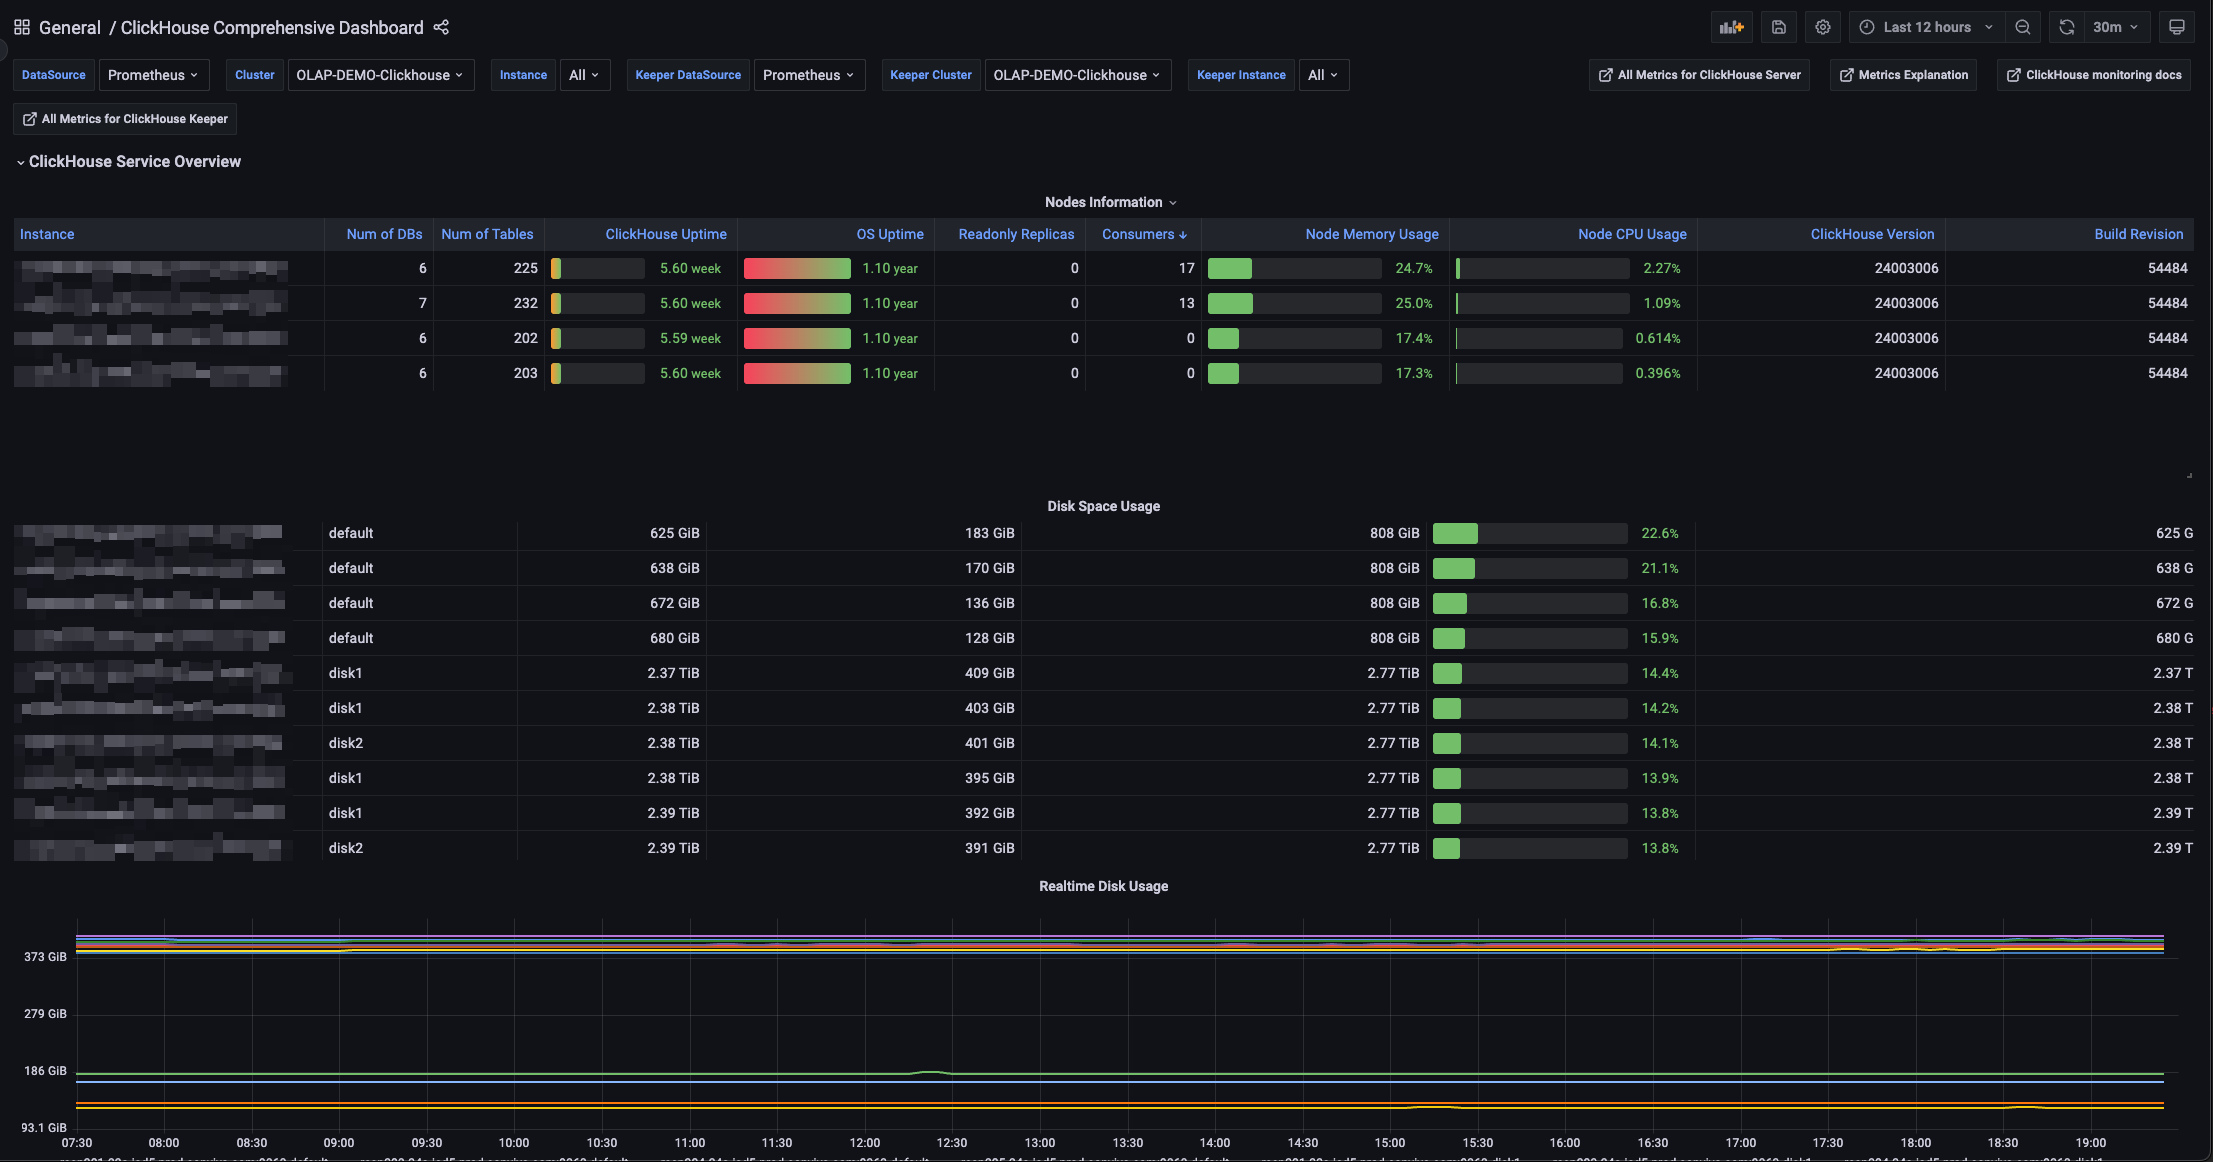
- Displays node state, version, uptime, number of tables and databases.
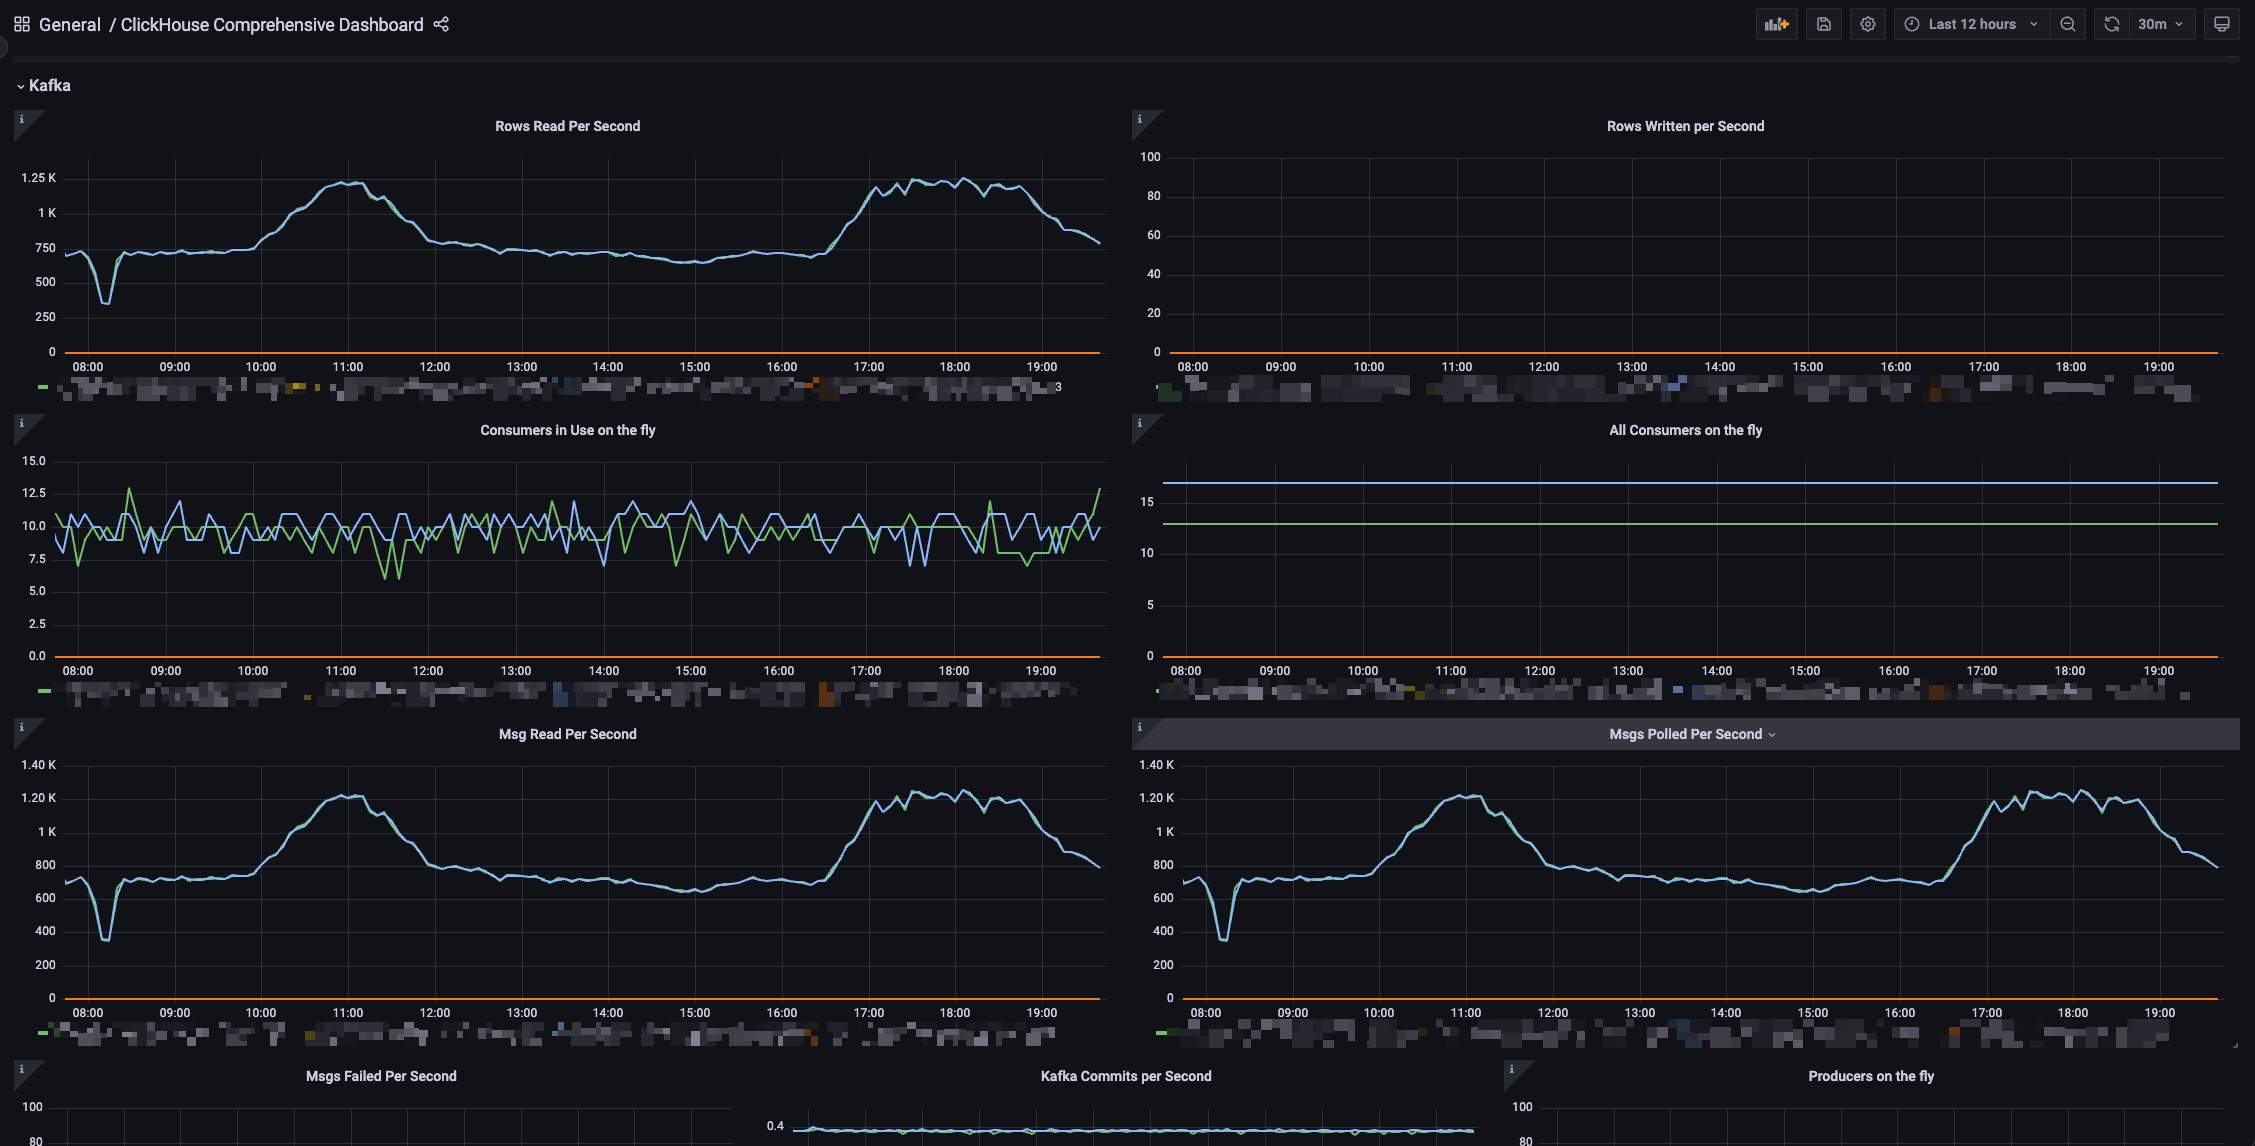
- Shows whether nodes are in read-only replica mode and Kafka consumer counts.
Resource Monitoring
- Tracks CPU and memory usage at both ClickHouse process and OS levels.
- Includes charts for system memory buffers, cache, and available memory.
Disk Usage Insights
- Visualizes total, used, available, and unreserved disk space for each mount point.
- Includes trends in disk usage over time (daily and per-10-minute deltas).
Real-Time Visualization
- Interactive time range and instance filtering.
- Supports multiple visual types: Table, Gauge, Graph, and Timeseries panels.
Highly Extensible
- Uses template variables like ${Cluster}, ${Instance}, and ${datasource} to support mulati-cluster setups.
- Modular and portable—easy to deploy across environments.
Quick Links
- External links to the ClickHouse metrics page, documentation, and optional internal wikis for metric explanations.
Compatibility
- Built with Grafana 9.1.4, compatible with Prometheus and ClickHouse /metrics endpoints.
Data source config
Collector type:
Collector plugins:
Collector config:
Revisions
Upload an updated version of an exported dashboard.json file from Grafana
| Revision | Description | Created | |
|---|---|---|---|
| Download |
ClickHouse
Monitor ClickHouse with Grafana. Easily keep tabs on your instance or cluster with Grafana Cloud's out-of-the-box monitoring solution.
Learn more