AI Metrics
Performance metrics for AI/ML RoCEv2 network traffic.
sFlow-RT AI Metrics
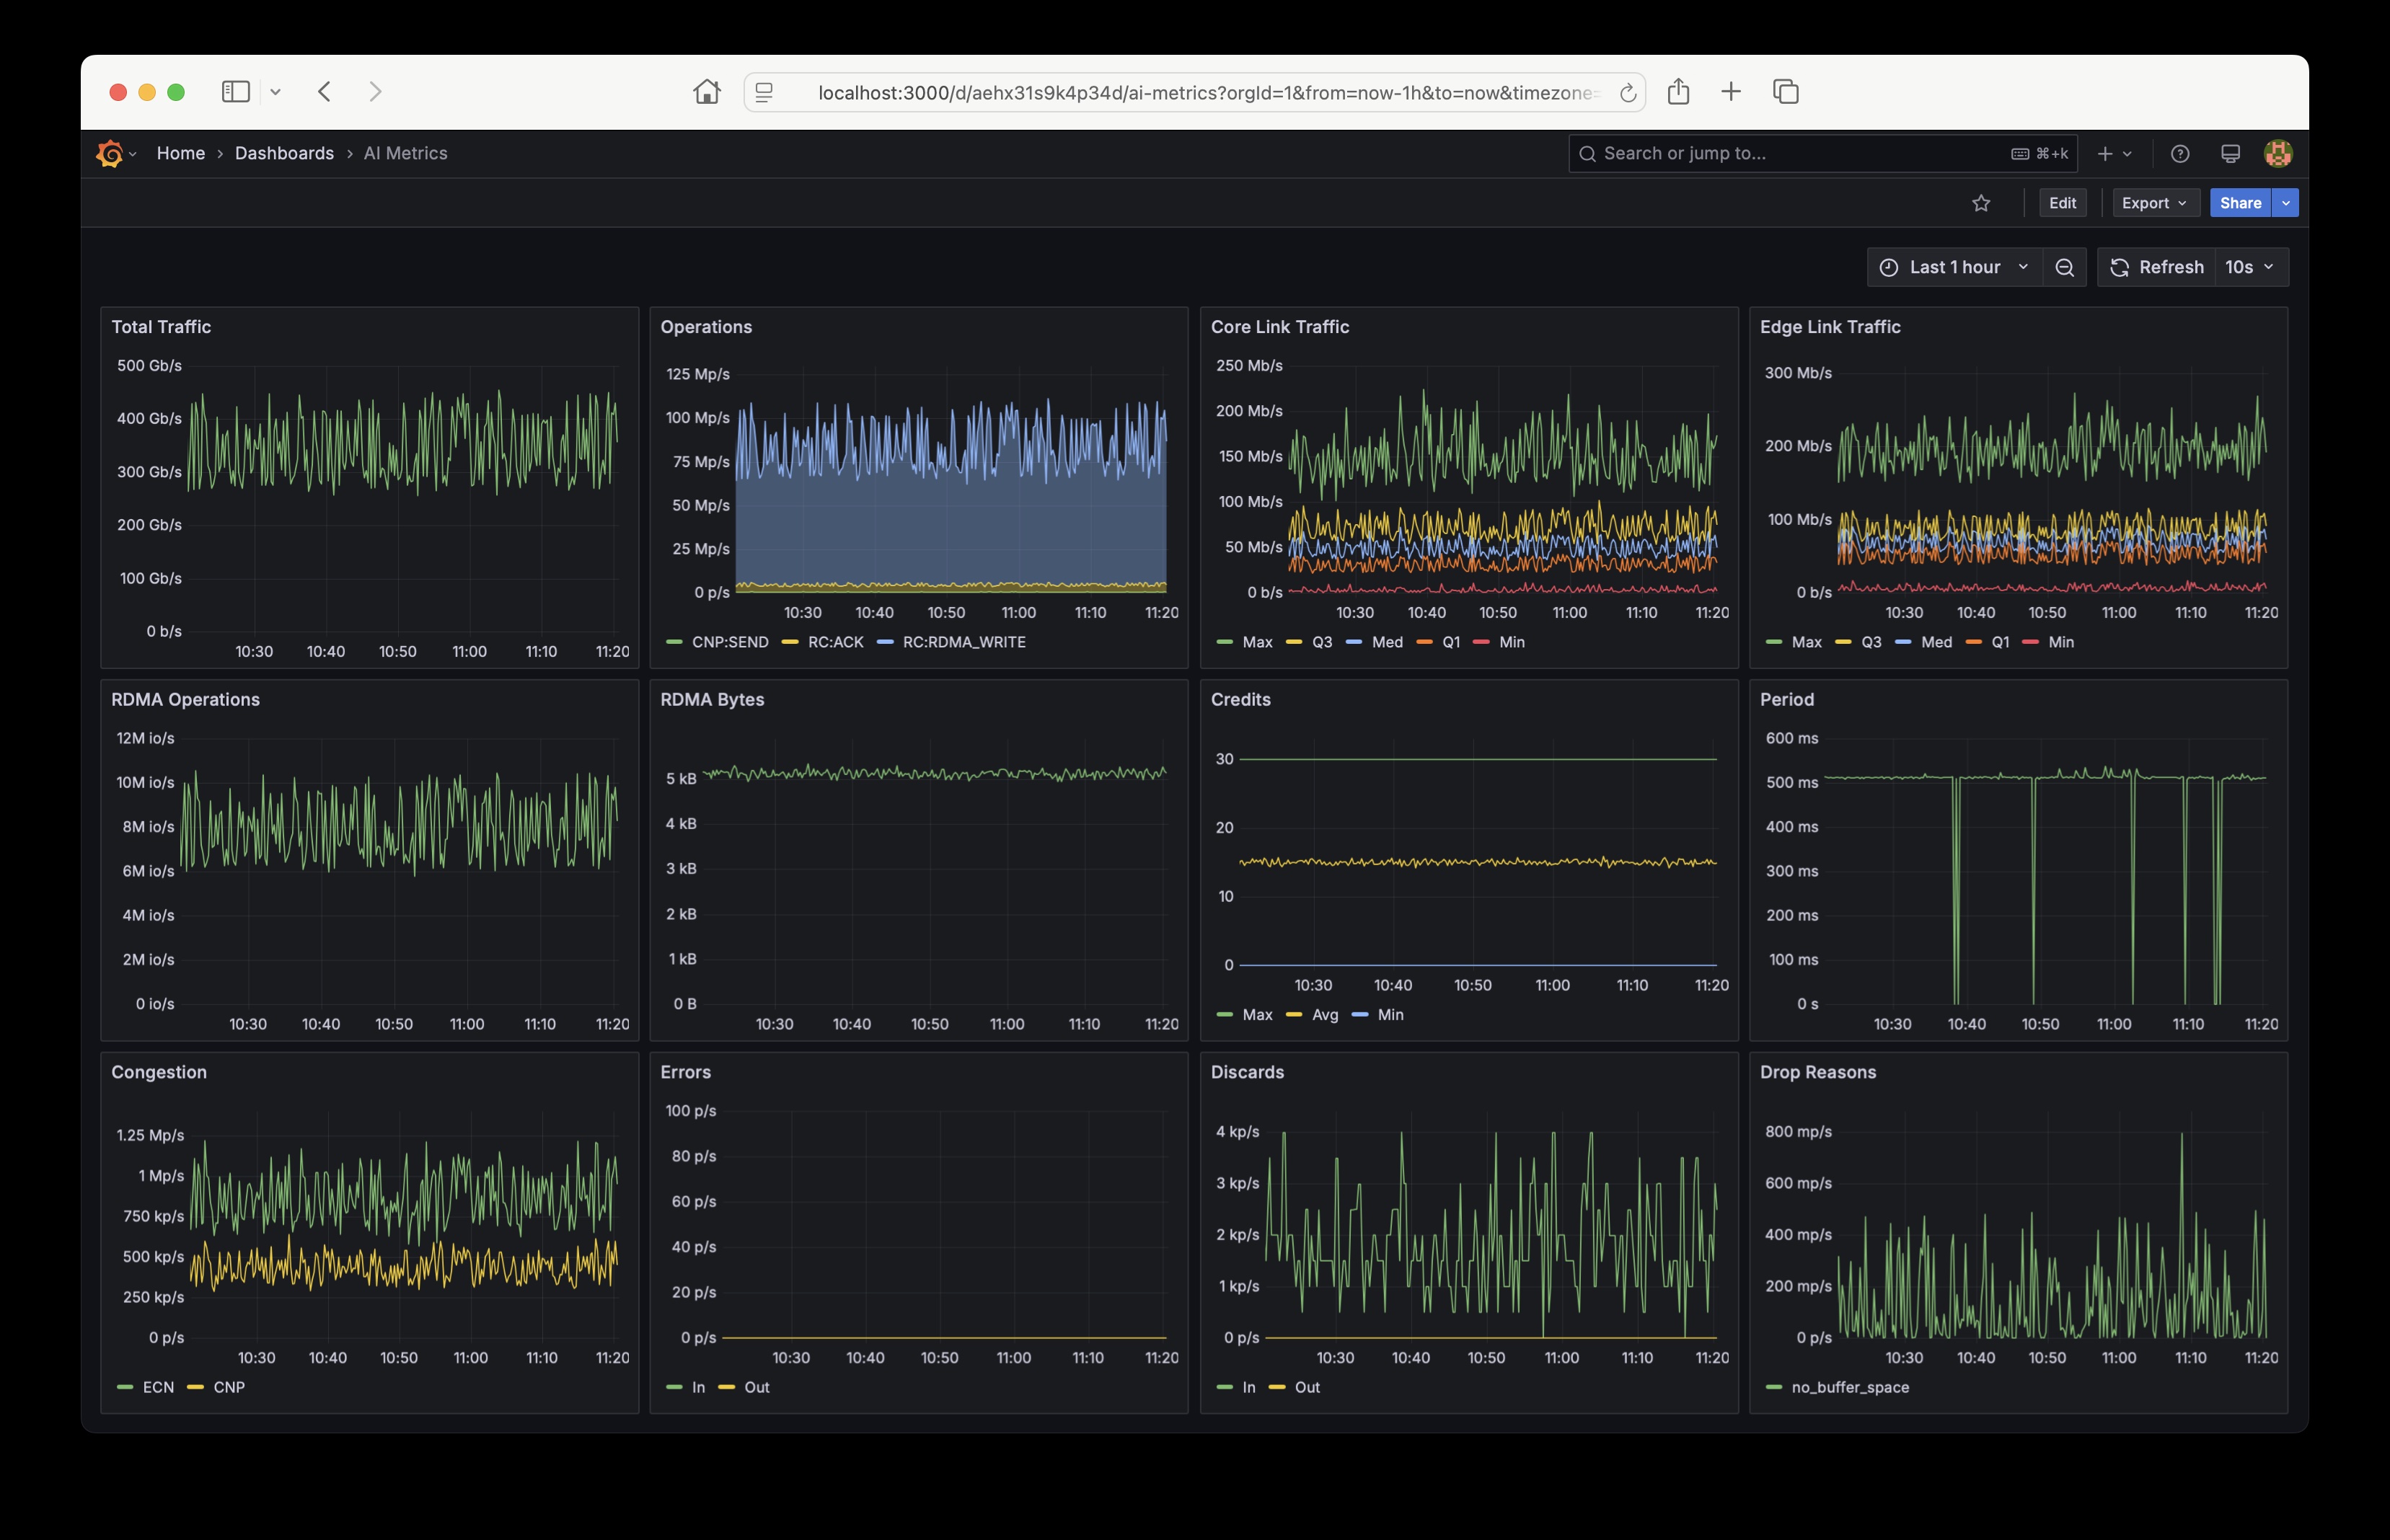
This dashboard trends metrics for AI/ML RoCEv2 network traffic reported by sFlow-RT analyzer running the ai-metrics application. The sFlow-RT analysis software collects streaming telemetry from industry standard sFlow Agents embedded in network devices.
Use the sflow/ai-metrics image to run sFlow-RT using Docker:
docker run -v $PWD/store:/sflow-rt/store/ -p 8008:8008 -p 6343:6343/udp sflow/ai-metrics
Use the following Prometheus scrape configuration to collect the metrics from sFlow-RT:
scrape_configs:
  - job_name: sflow-rt-ai-metrics
    metrics_path: /app/ai-metrics/scripts/metrics.js/prometheus/txt
    static_configs:
    - targets: ['sflow-rt.mysite.org:8008']
Data source config
Collector type:
Collector plugins:
Collector config:
Revisions
Upload an updated version of an exported dashboard.json file from Grafana
| Revision | Description | Created | |
|---|---|---|---|
| Download |