Intel GPU Metrics
Intel GPU Metrics based on the prometheus metrics from https://github.com/onedr0p/intel-gpu-exporter
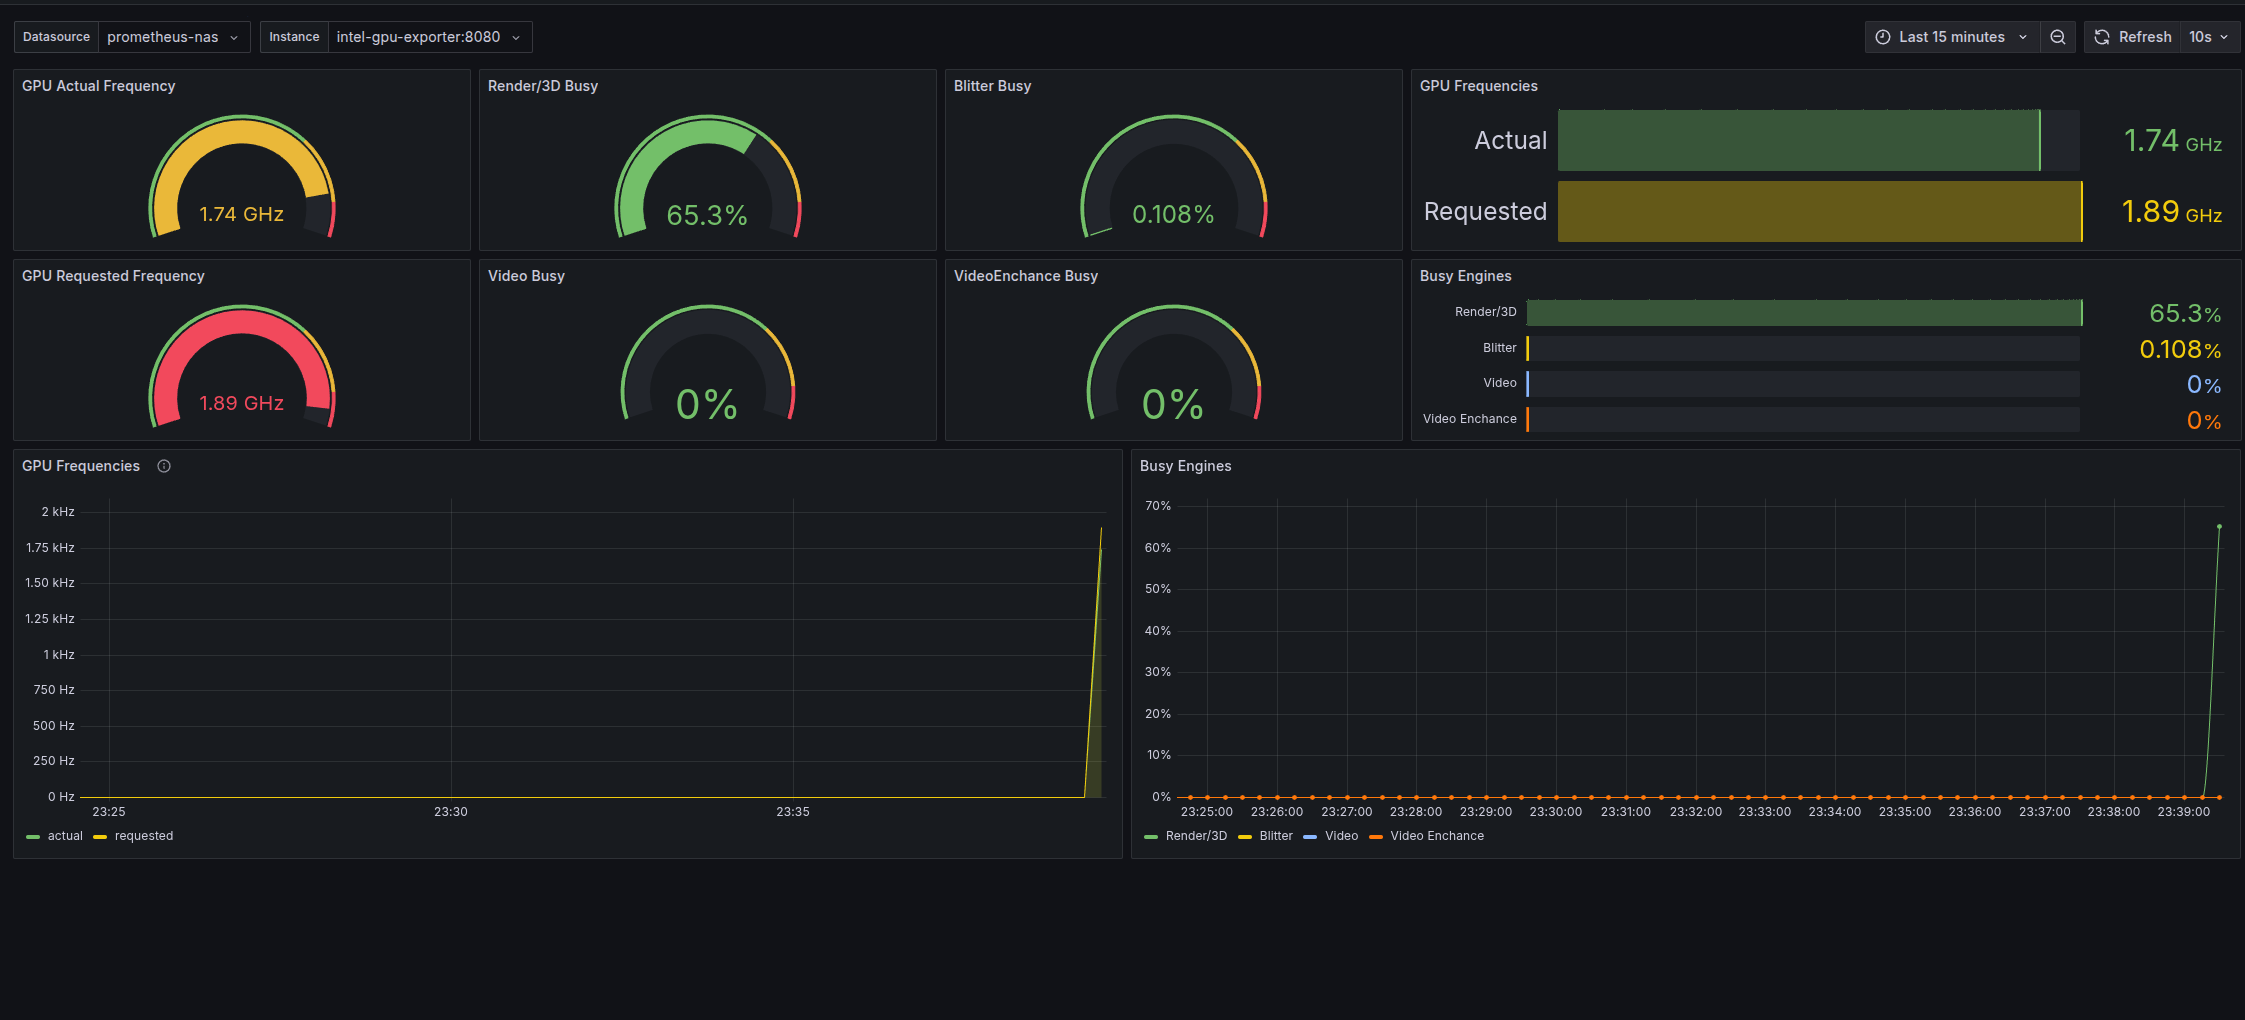
This dashboard works for Intel Arc cards or Intel iGPUs, however it has only been configured for one GPU at a time. The objective was to provide a dashboard with a prometheus source, since those available in Grafana labs mostly use InfluxDB.
To configure it correctly, you can use the following docker compose file:
services:
  intel-gpu-exporter:
    image: ghcr.io/onedr0p/intel-gpu-exporter:rolling
    container_name: intel-gpu-exporter
    restart: unless-stopped
    privileged: true
    pid: host
    ports:
      - "8081:8080"
    volumes:
      - /dev/dri/:/dev/dri/
And then. in your prometheus scrapers configuration:
  # Intel GPU exporter
  - job_name: 'intel-gpu' # The job name is hardcoded  into the dashboard,
    #scrape_interval: 5s
    static_configs:
      - targets: [ 'host.docker.internal:8081' ]
Data source config
Collector type:
Collector plugins:
Collector config:
Revisions
Upload an updated version of an exported dashboard.json file from Grafana
| Revision | Description | Created | |
|---|---|---|---|
| Download |