OpenTelemetry & Tempo
OpenTelemetry & Tempo Performance Monitoring
Description:
This dashboard provides comprehensive observability into the performance and health of key components within an OpenTelemetry and Tempo tracing pipeline.
For OpenTelemetry, it covers essential telemetry pipeline stages, including:
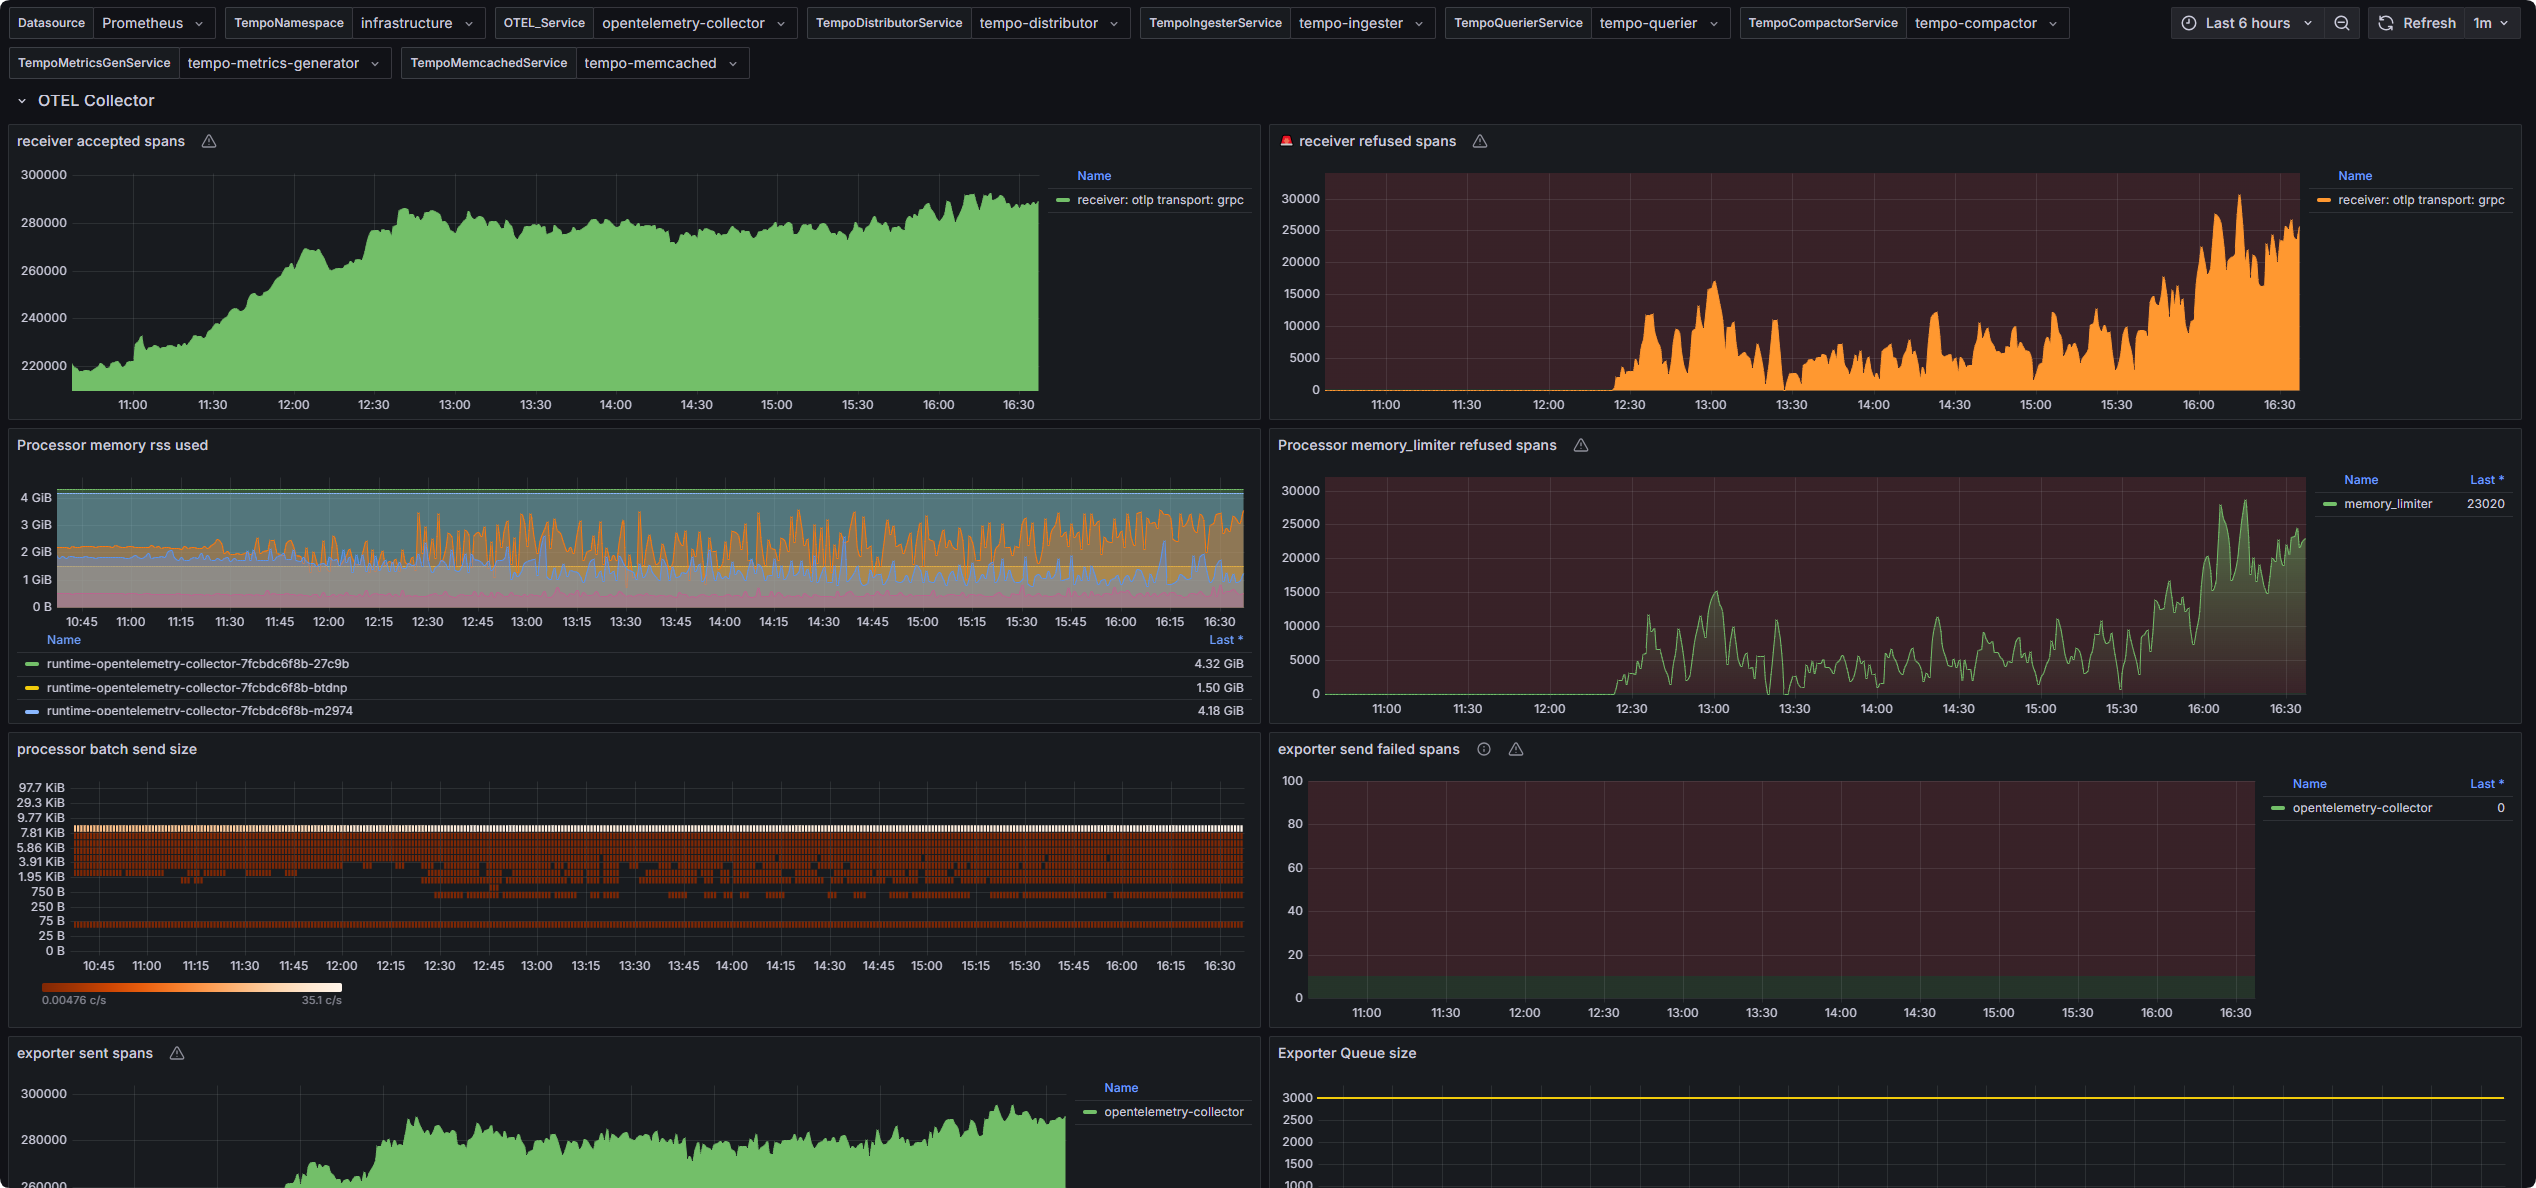
Receivers: Track ingestion performance and data throughput.
Processors: Monitor the efficiency and latency of processors like batch and memory limiter.
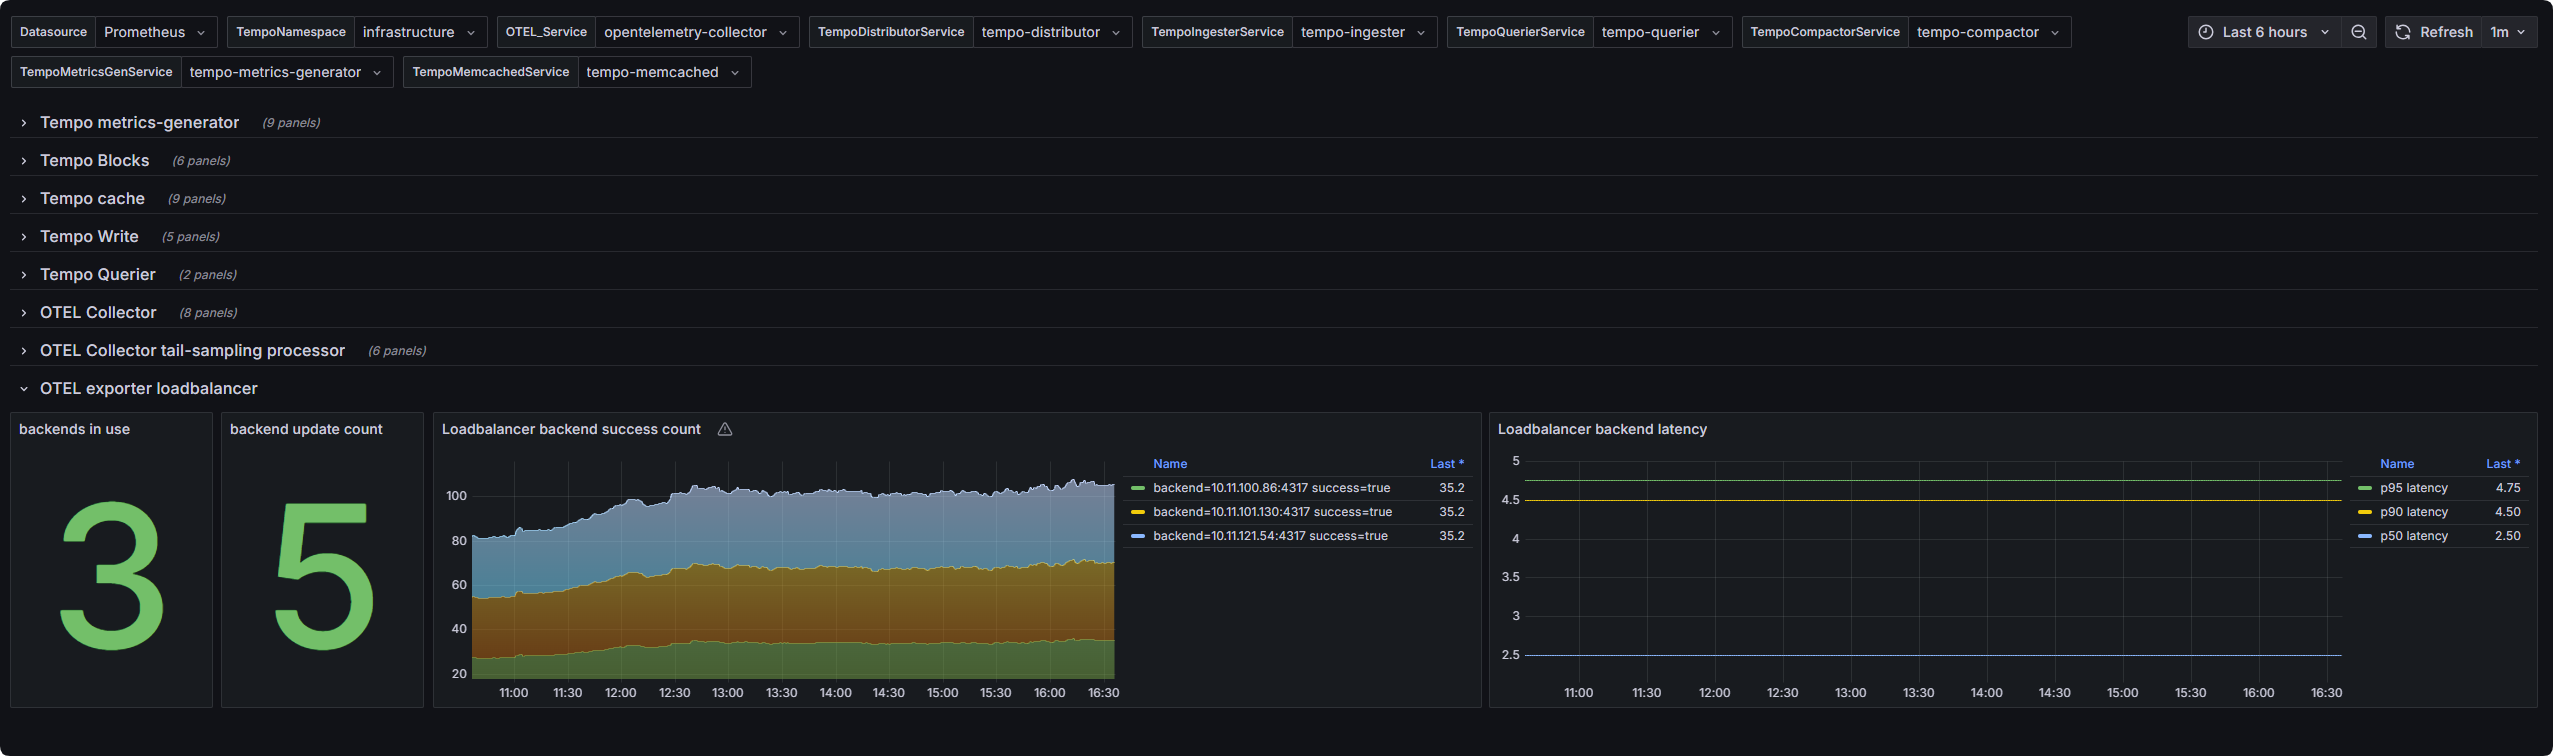
Exporters: Visualize export success rate and performance to backend systems.
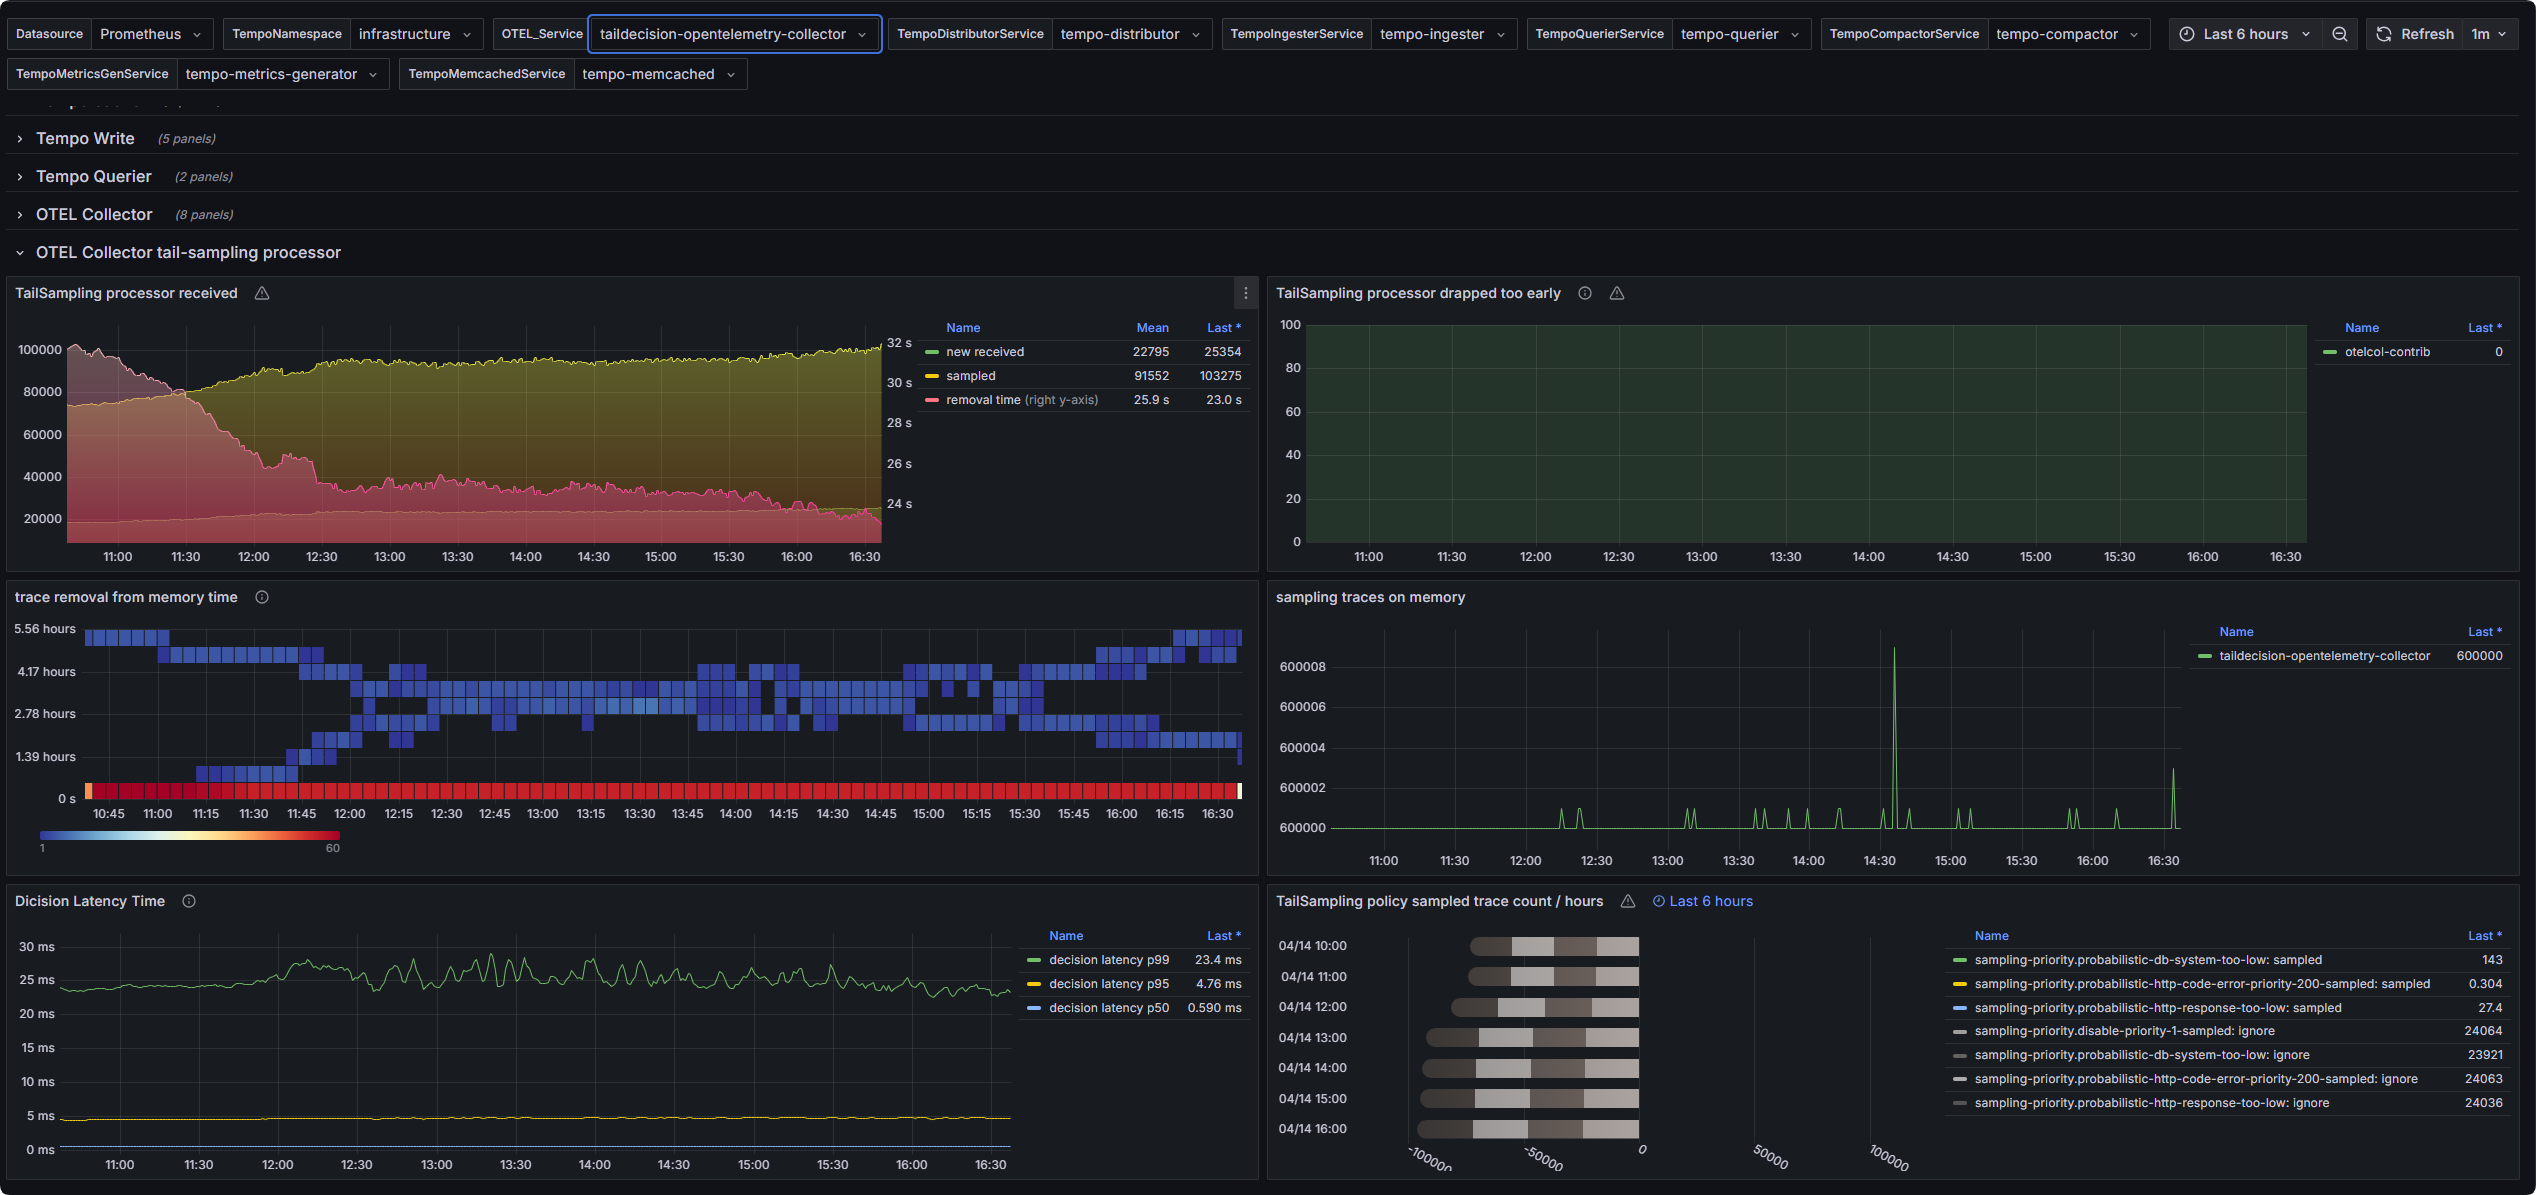
Tail Sampling Processor: Gain insights into the sampling decision performance and dropped spans.
For Tempo, the dashboard includes detailed metrics on:
Querier: Monitor query latency, throughput, and cache hit/miss rates.
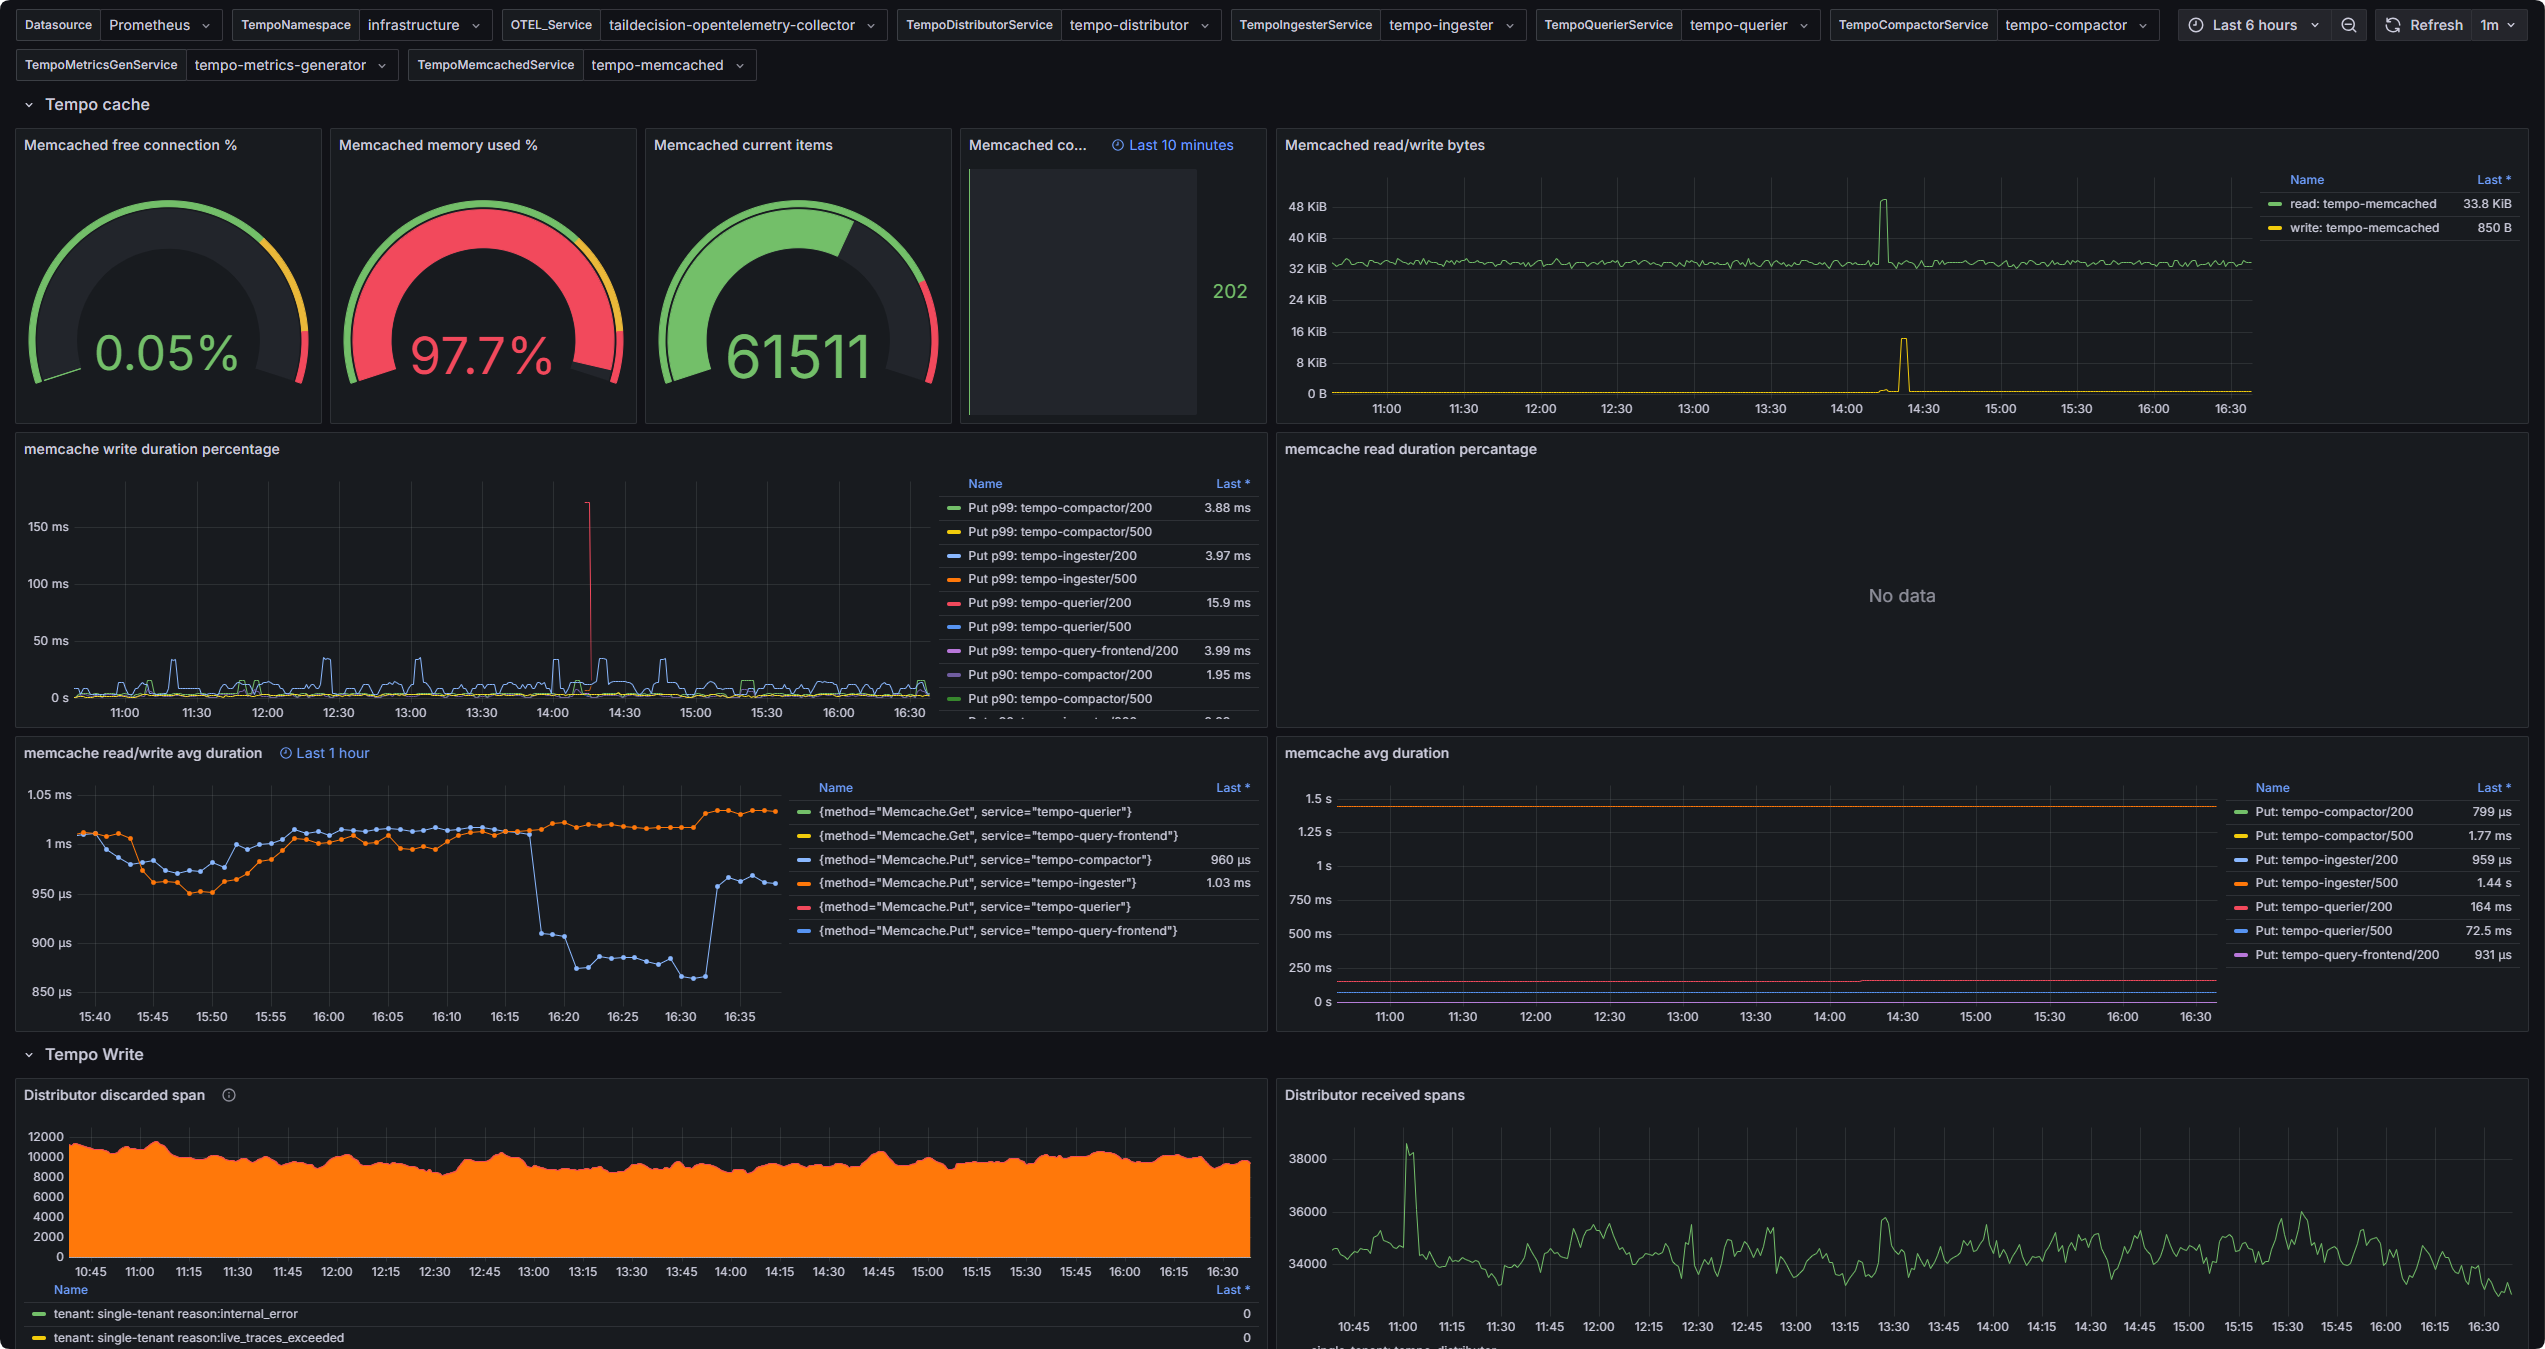
Writer: Track write operations, latency, and error rates.
Cache: Observe cache utilization and efficiency.
Blocks: Visualize block compaction, size, and retention metrics.
Metrics Generator: Display metrics related to trace-to-metrics generation.
This dashboard is designed to help users quickly identify bottlenecks, optimize pipeline performance, and ensure the reliability of their distributed tracing infrastructure.
Data source config
Collector config:
Upload an updated version of an exported dashboard.json file from Grafana
| Revision | Description | Created | |
|---|---|---|---|
| Download |