Envoy Proxy Monitoring gRPC
A comprehensive dashboard for real-time monitoring of Envoy Proxy metrics using Prometheus. Includes upstream/downstream request rates, memory usage, gRPC status codes, connection resets, latency percentiles (p95/p99), cluster health, and traffic in/out — with built-in IP/cluster filtering and clear color-coded visualization. Perfect for high-performance gRPC, HTTP/1/2/3, and service mesh environments.
📌 Overview
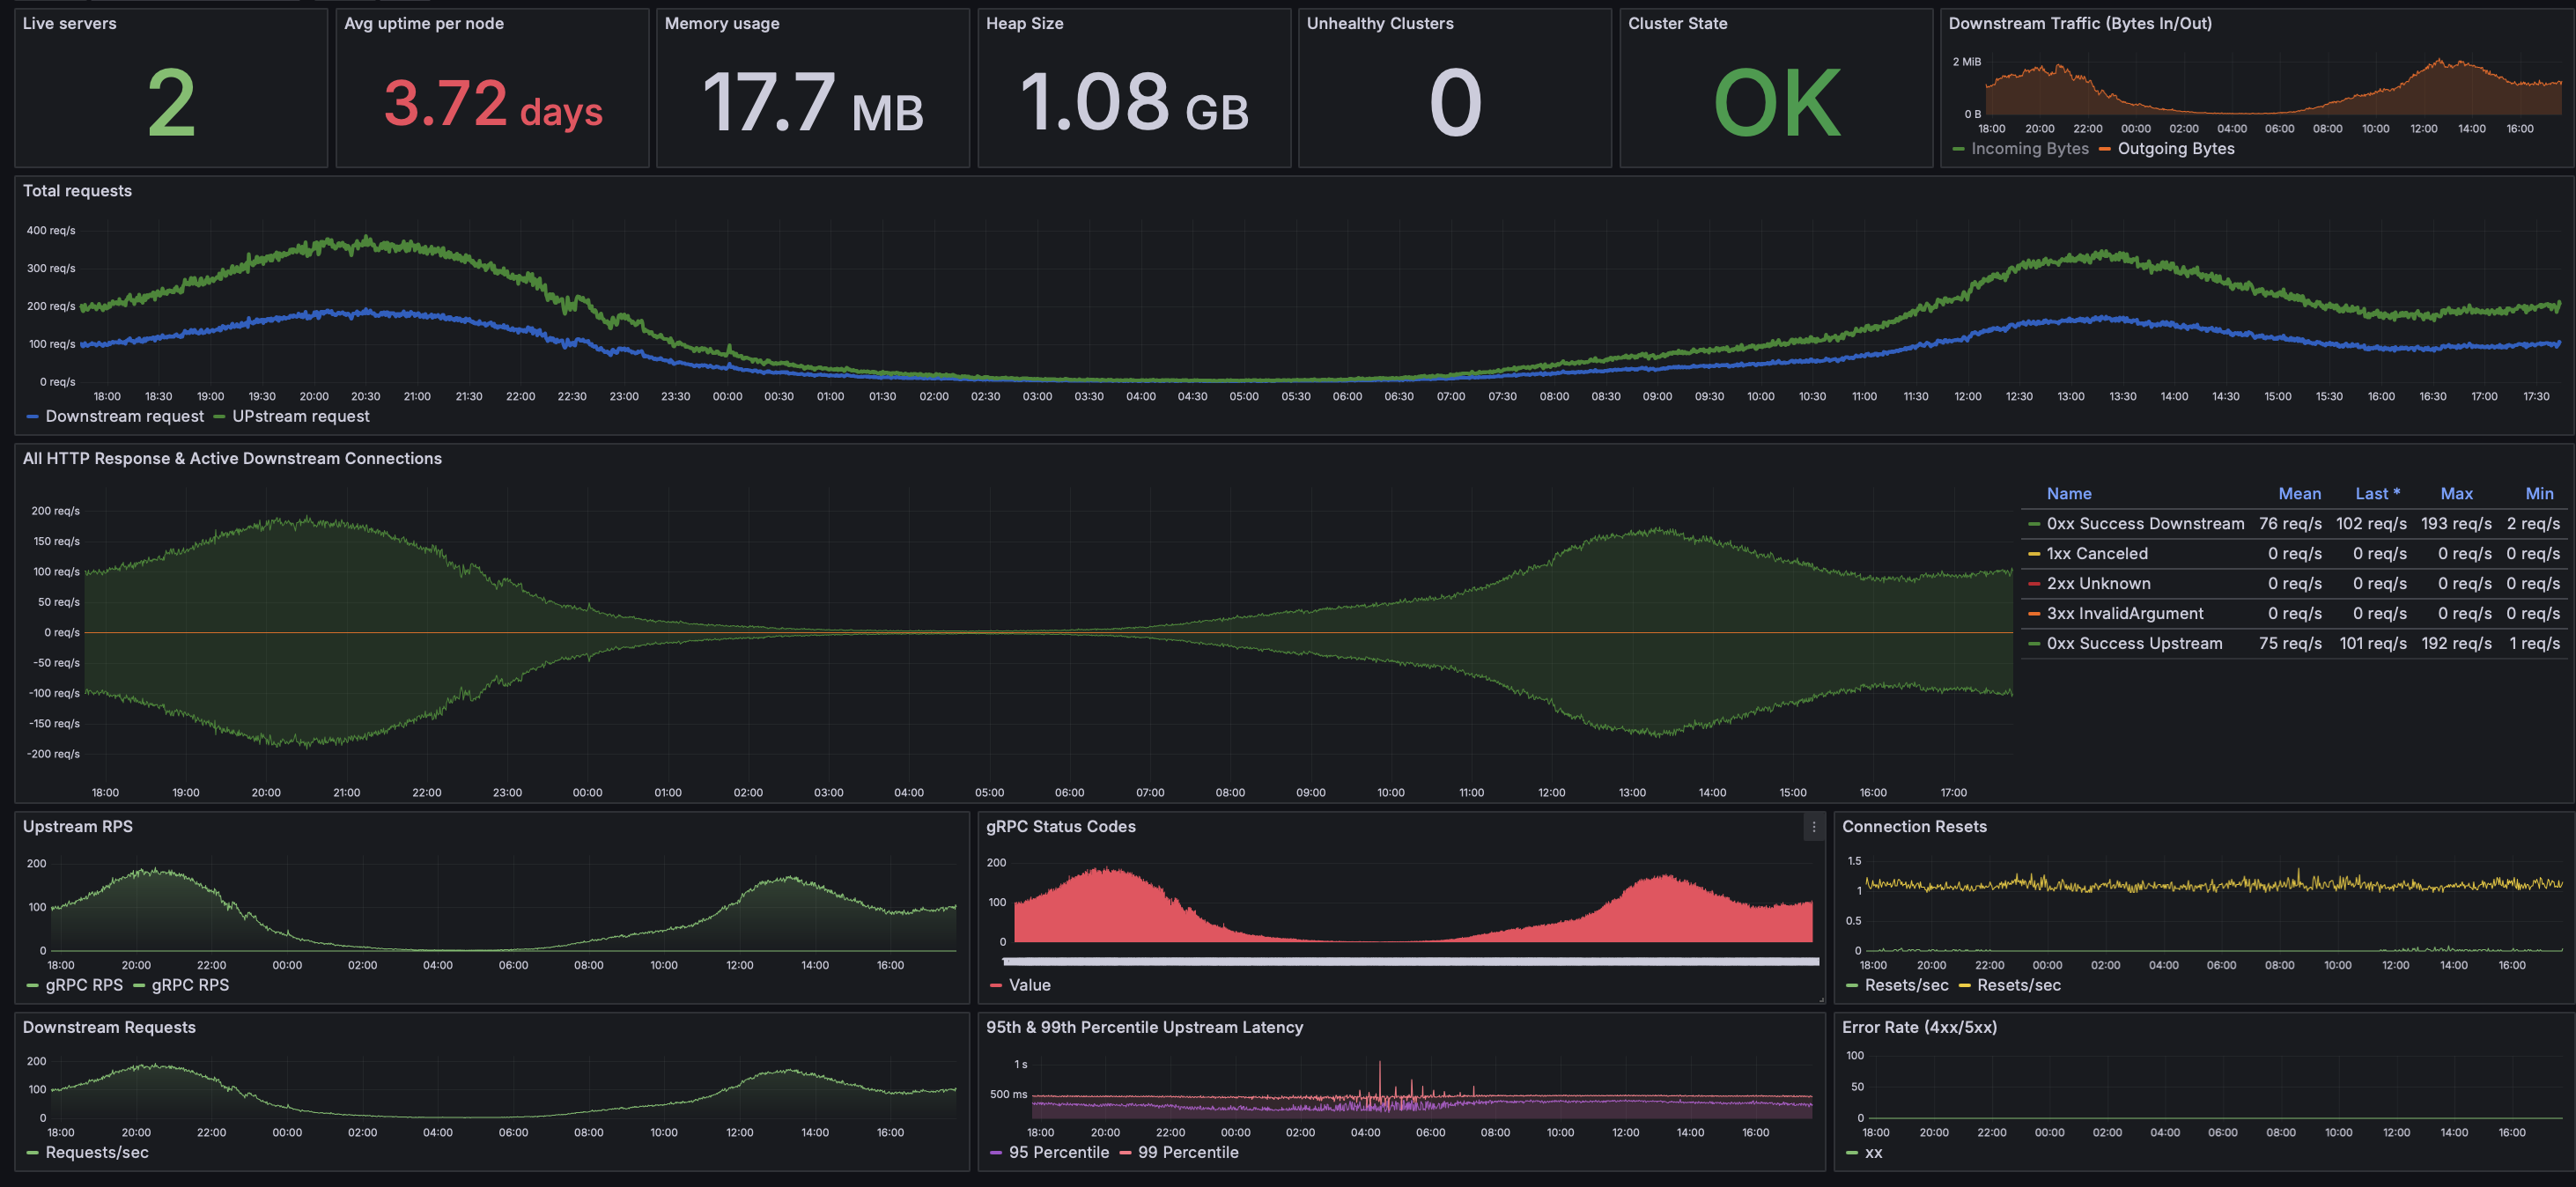
This dashboard provides a full-stack view of your Envoy Proxy nodes, aggregating Prometheus metrics into insightful panels that track both performance and health.
It supports: • HTTP/gRPC traffic flow (Downstream + Upstream) • Memory and CPU insight • Request/response code breakdown (1xx → 5xx) • Latency tracking (p95 & p99 percentiles) • Cluster health check • Real-time host filtering
🧪 Requirements • Envoy Proxy with Prometheus stats endpoint enabled • Prometheus as a datasource • Grafana 8.x–11.x supported
All queries use $hosts filtering for per-instance inspection. You can disable or override it based on your environment.
📦 How to Use 1. Import into Grafana via JSON or Dashboard ID 2. Connect to your Prometheus data source 3. Adjust $hosts or $cluster variables as needed
Data source config
Collector config:
Upload an updated version of an exported dashboard.json file from Grafana
| Revision | Description | Created | |
|---|---|---|---|
| Download |
Envoy
Easily monitor Envoy, an open source edge and service proxy, designed for cloud-native applications, with Grafana Cloud's out-of-the-box monitoring solution.
Learn more