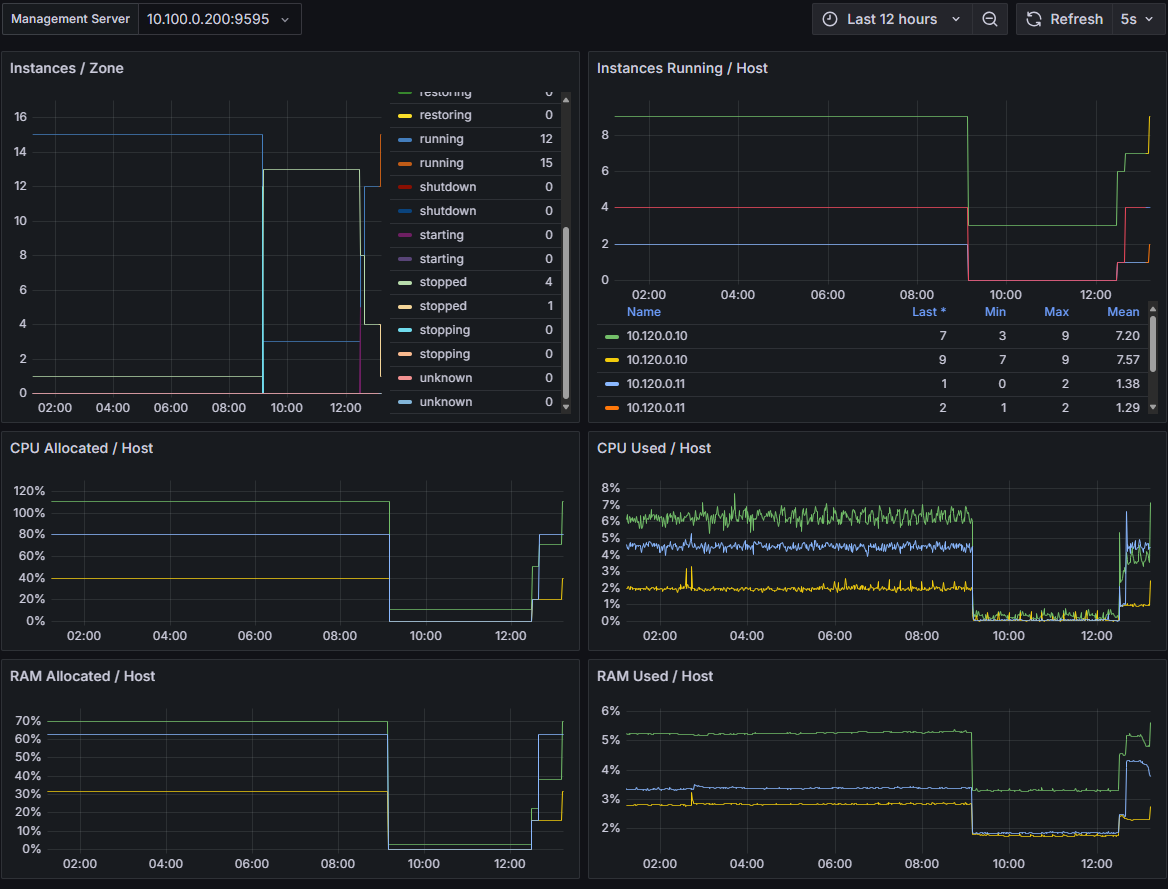
CloudStack Management
Metrics from the native plugin Prometheus Exporter of CloudStack
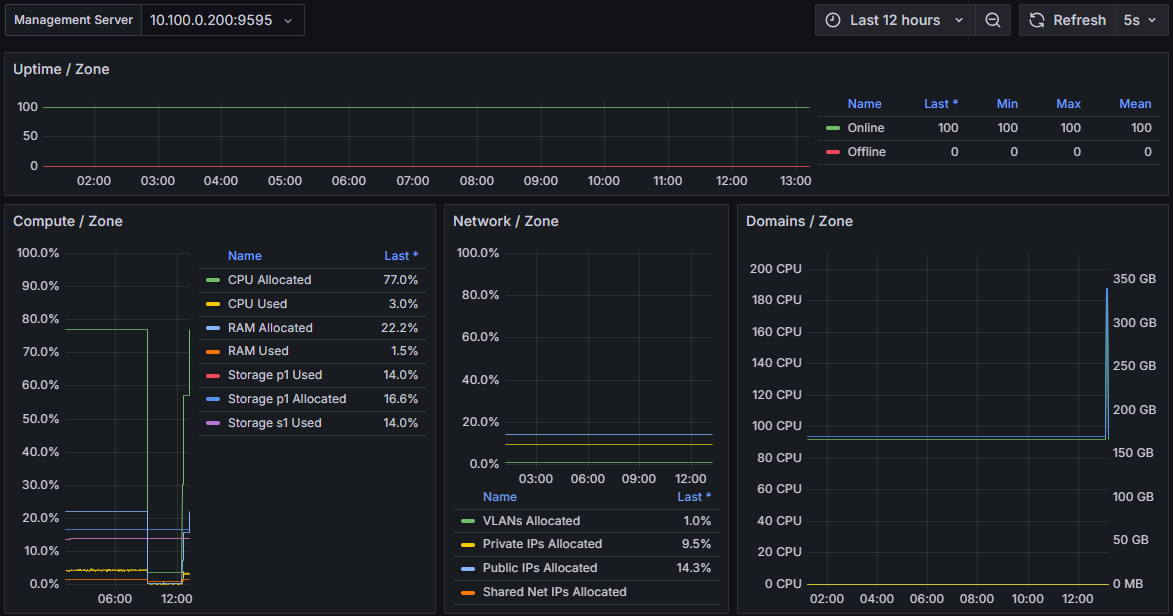
There is no documentation yet in CloudStack but it can be enabled by setting the following global settings (requires restarting the Management service): prometheus.exporter.enable = true (default: false) prometheus.exporter.port = 9595 (default: 9595) prometheus.exporter.allowed.ips = 127.0.0.1,192.168.69.69 (comma separated, default: 127.0.0.1)
The native plugin feature can be found here: https://github.com/apache/cloudstack/blob/main/plugins/integrations/prometheus/src/main/java/org/apache/cloudstack/metrics/PrometheusExporterServer.java
Data source config
Collector type:
Collector plugins:
Collector config:
Revisions
Upload an updated version of an exported dashboard.json file from Grafana
| Revision | Description | Created | |
|---|---|---|---|
| Download |