AWS Trusted Advisor
AWS Trusted Advisor dashboard is designed to monitor and display the status of Trusted Advisor checks by visualising the severity of issues using AWS CloudWatch data.
AWS Trusted Advisor Dashboard
AWS Support Plan Requirements
To use AWS Trusted Advisor, you must have an AWS Support plan. The minimum required plan is the Developer Support tier. You can manage your support plan at:
Overview
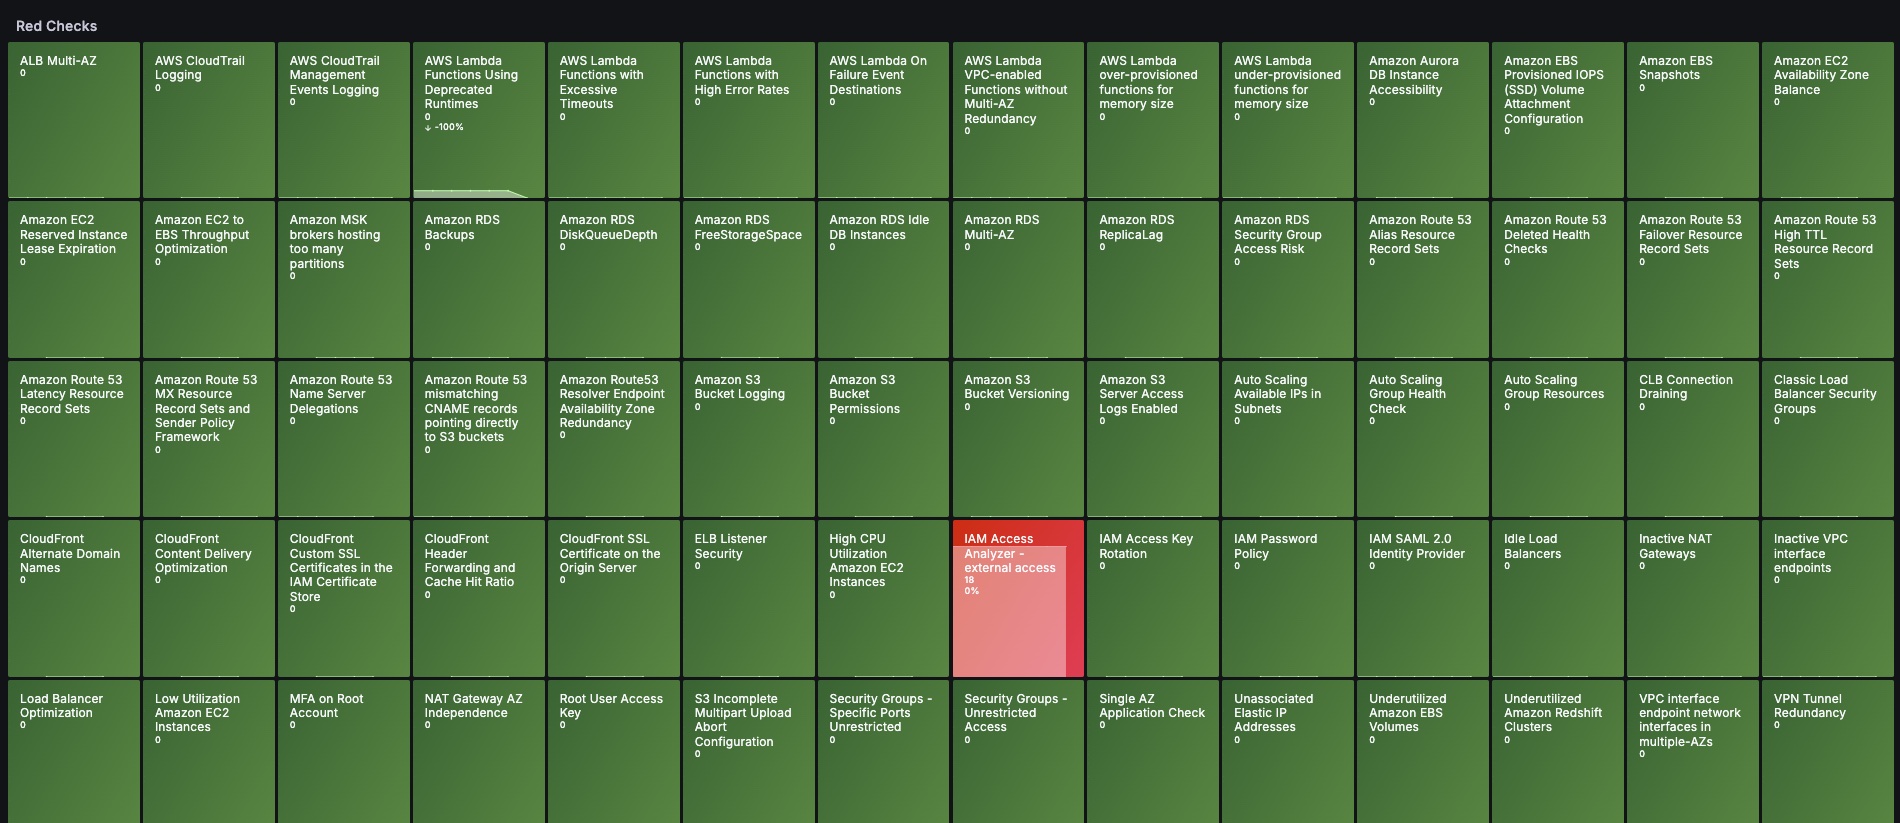
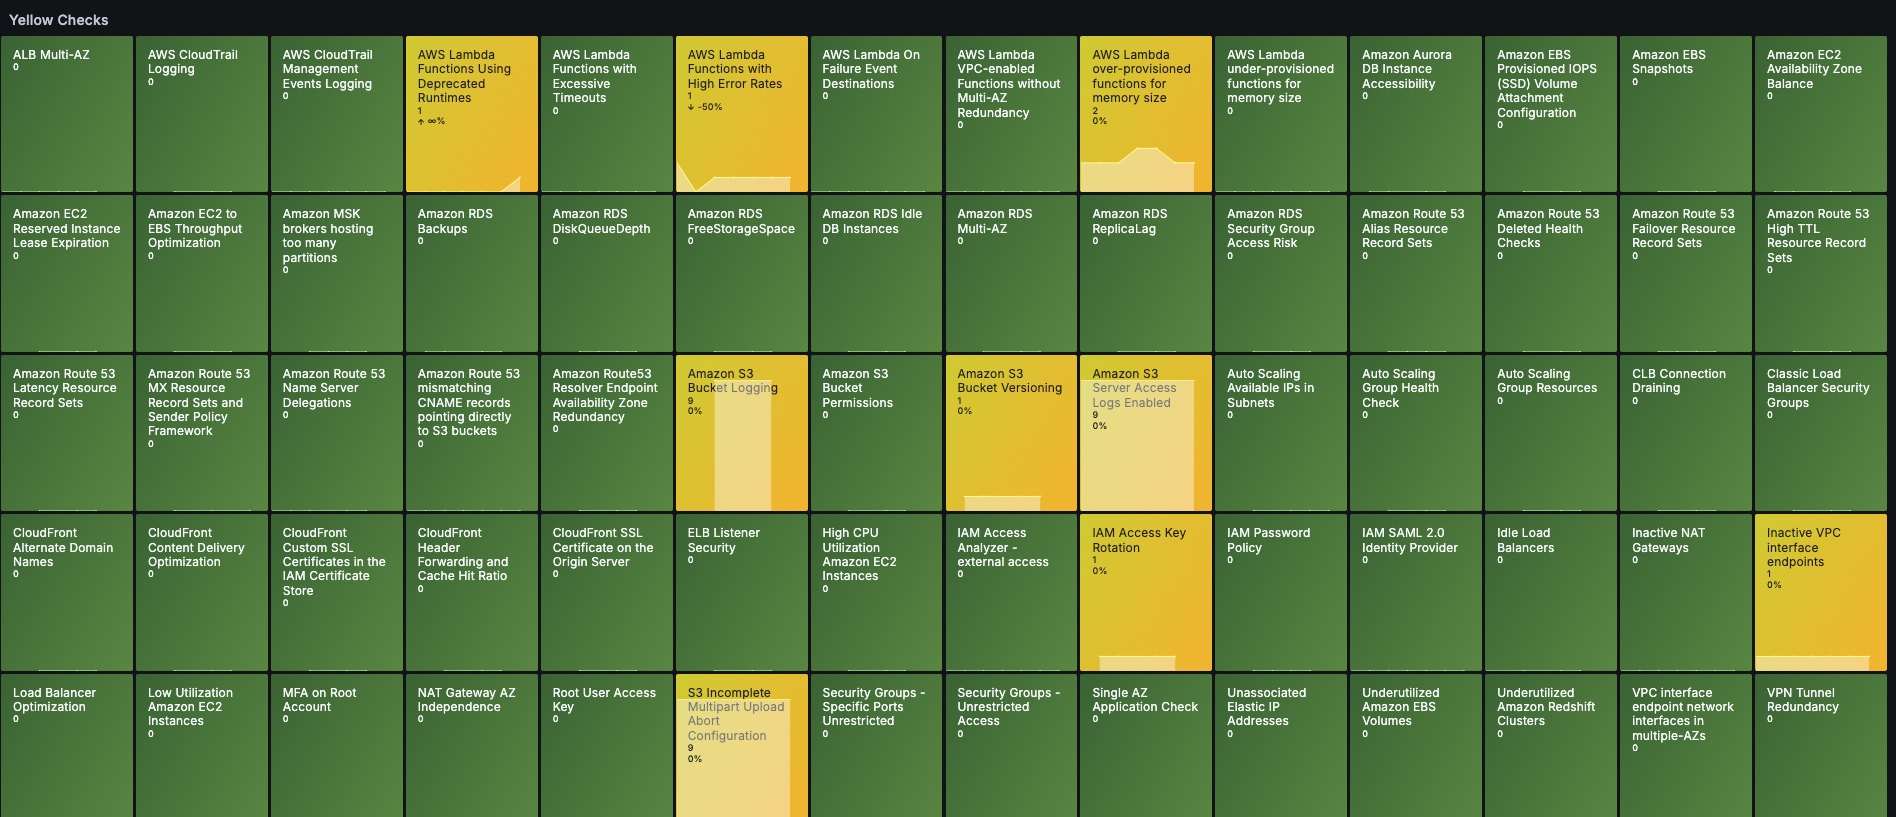
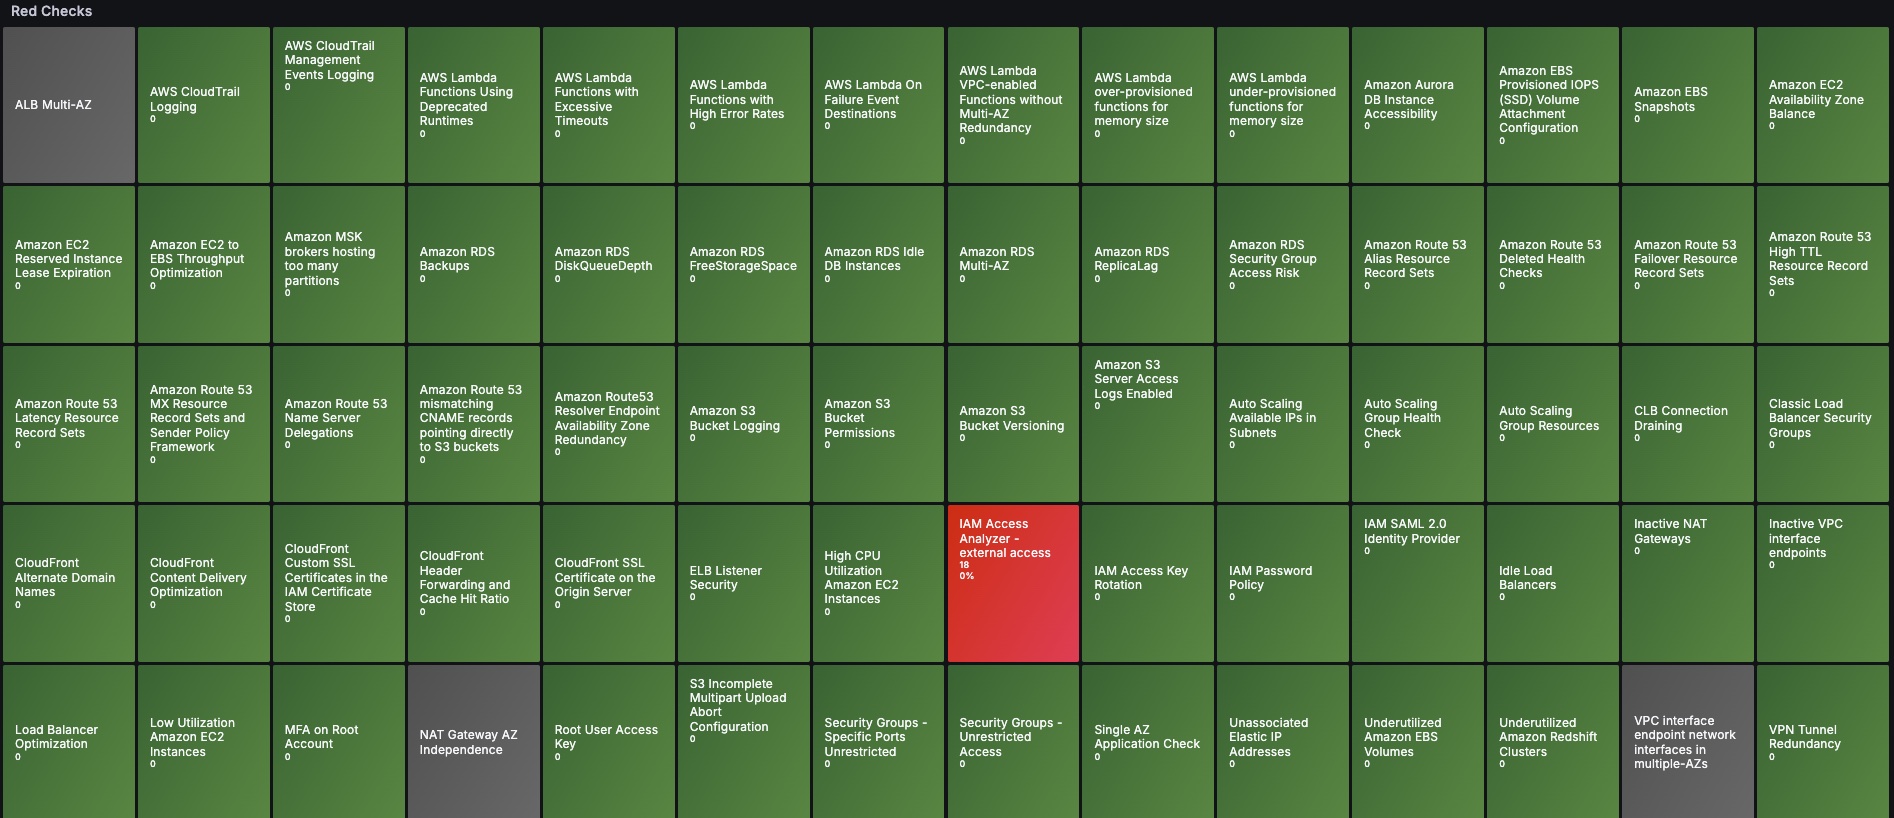
This dashboard provides real-time monitoring of AWS Trusted Advisor checks, helping you identify and track potential issues in your AWS infrastructure. It visualizes both critical (Red) and warning (Yellow) issues across various Trusted Advisor categories. The dashboard is specifically configured for the US East (N. Virginia) region (us-east-1). The dashboard allows you to:
- View check history over different time periods
- Track the evolution of issues over time
- Monitor the effectiveness of remediation actions
- Identify recurring patterns in resource issues
Key Features
- Real-time monitoring of Trusted Advisor checks in us-east-1 region
- Color-coded severity indicators:
- Red: Critical issues requiring immediate attention
- Yellow: Warning issues that should be monitored
- Grey: Check not yet performed by AWS
- Historical data visualization
- Two key metrics per check:
- Number of resources affected by the issue
- Percentage variation in the number of affected resources
- Automatic refresh of check status
- Customizable time range (default: last 7 days)
CloudWatch Metrics
The dashboard uses the following AWS CloudWatch metrics from the AWS/TrustedAdvisor namespace:
RedResources: Number of resources with critical issuesYellowResources: Number of resources with warning issues
Links
Configuration
- Data Source: AWS CloudWatch
- Region: us-east-1 (N. Virginia)
Tags
- cloudwatch
- Trusted Advisor
- AWS
- Monitoring
- Infrastructure
- us-east-1
Requirements
- Grafana 12.0.0 or higher
- AWS CloudWatch datasource configured
- Appropriate AWS IAM permissions for Trusted Advisor
Data source config
Collector config:
Upload an updated version of an exported dashboard.json file from Grafana
| Revision | Description | Created | |
|---|---|---|---|
| Download |
AWS
Easily visualize and alert on more than 60 Amazon Web Services (AWS) resources using the fully managed Grafana Cloud platform.
Learn more