Vertiv NUT UPS Dashboard
A professional and modern Grafana dashboard to monitor UPS devices using [Network UPS Tools (NUT)](https://networkupstools.org/) via Prometheus.
Vertiv NUT UPS Dashboard
A professional and modern Grafana dashboard to monitor UPS devices using Network UPS Tools (NUT) via Prometheus.
Built to work with:
- ⚡️ Multiple UPSes (Vertiv, APC, etc.)
- 📊 Prometheus Exporter: vertiv-nut-exporter
- 🐳 Docker Image: Docker Hub
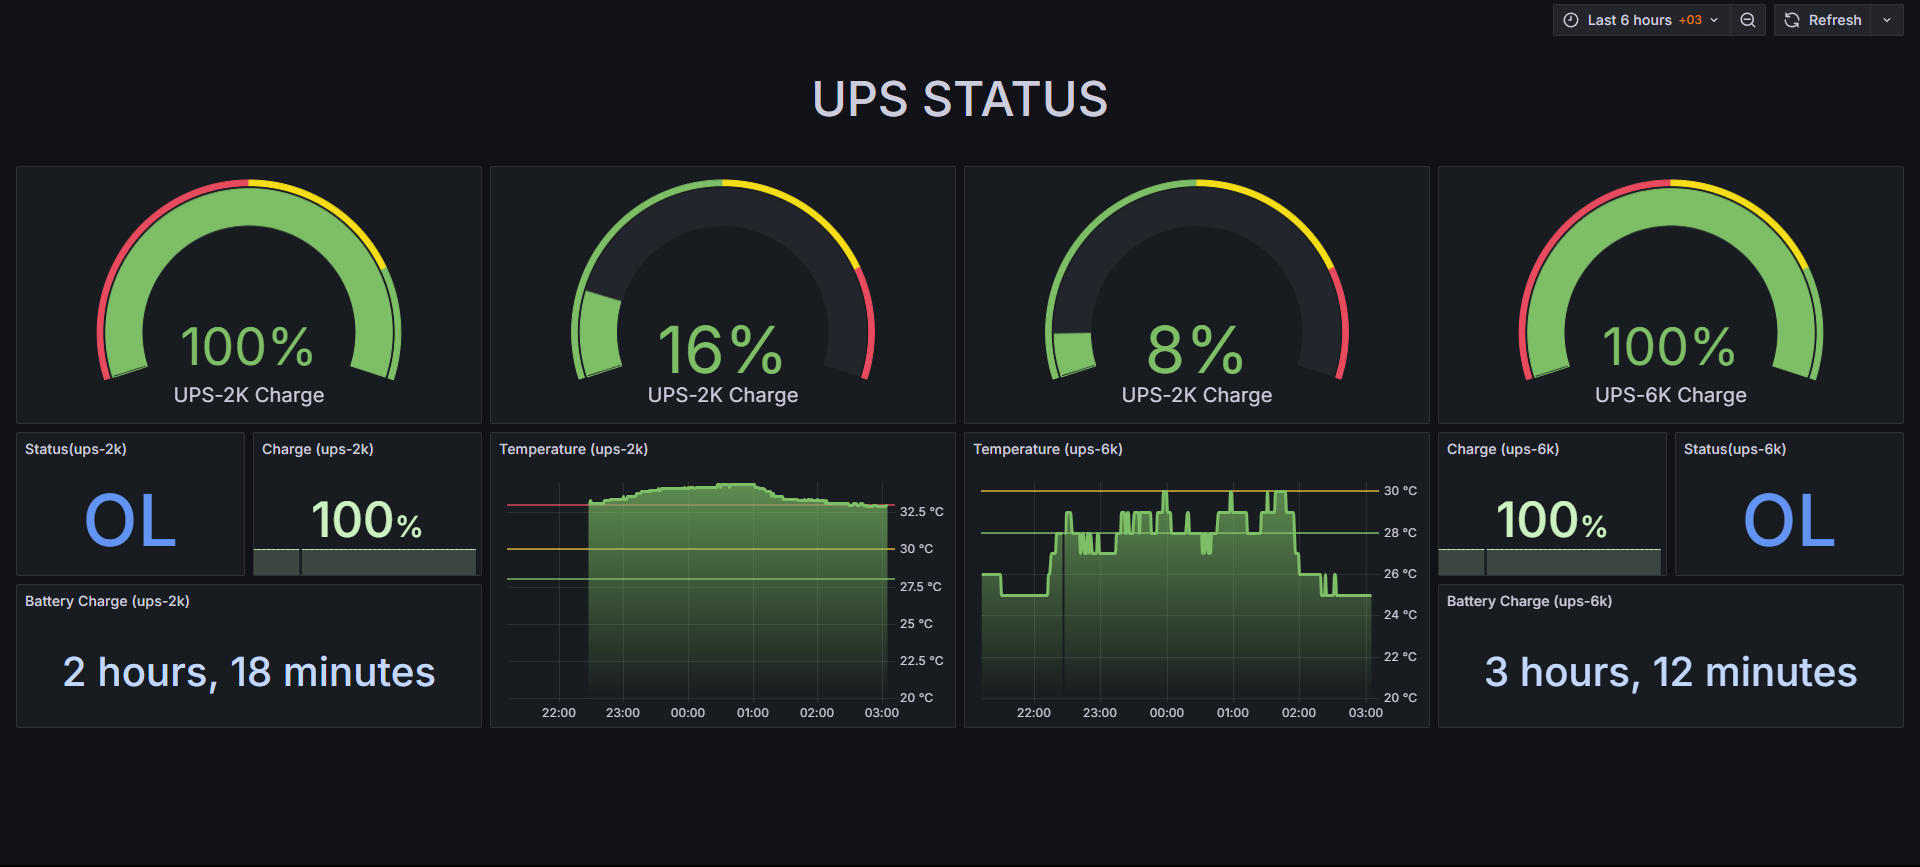
📋 Features
- Battery Charge Gauge & Time Remaining
- Status (Online/On Battery)
- UPS Temperature Graphs
- Multiple UPS support
- Easy to deploy, lightweight, and responsive
🧰 Requirements
- Prometheus scraping metrics from your UPS exporter
- Metrics path:
/metrics - Recommended scrape interval:
30sor1m
📦 How to Use
- Deploy vertiv-nut-exporter using Docker:
docker run -d \
  -p 9000:9000 \
  -v /path/to/config.json:/var/www/html/config.json \
  fayezvip/vertiv-nut-exporter:latest
2- Import this dashboard into Grafana (v10+)
3- Set Prometheus as your data source
4- Done ✅
💻 Open Source & Contributions GitHub: github.com/fayezvip/vertiv-nut-exporter
Data source config
Collector type:
Collector plugins:
Collector config:
Revisions
Upload an updated version of an exported dashboard.json file from Grafana
| Revision | Description | Created | |
|---|---|---|---|
| Download |