CompassVPN Dashboard
The CompassVPN Dashboard offers real-time monitoring of VPN infrastructure, with server metrics, Xray traffic, and config health. Track resources, connections, bandwidth, and routing in one place.
CompassVPN Dashboard
Monitoring for CompassVPN infrastructure in one place: server resources, Xray traffic, routing analytics, and VPN config health.
- Website: compassvpn.org
- Agent GitHub: github.com/compassvpn/agent
- Manager GitHub: github.com/compassvpn/manager
Overview
The dashboard combines system metrics, Xray traffic and routing data, and per-config health into a single view, filterable by provider and server (the Donor and Instance variables). It monitors configuration health. It does not manage configuration.
What it shows
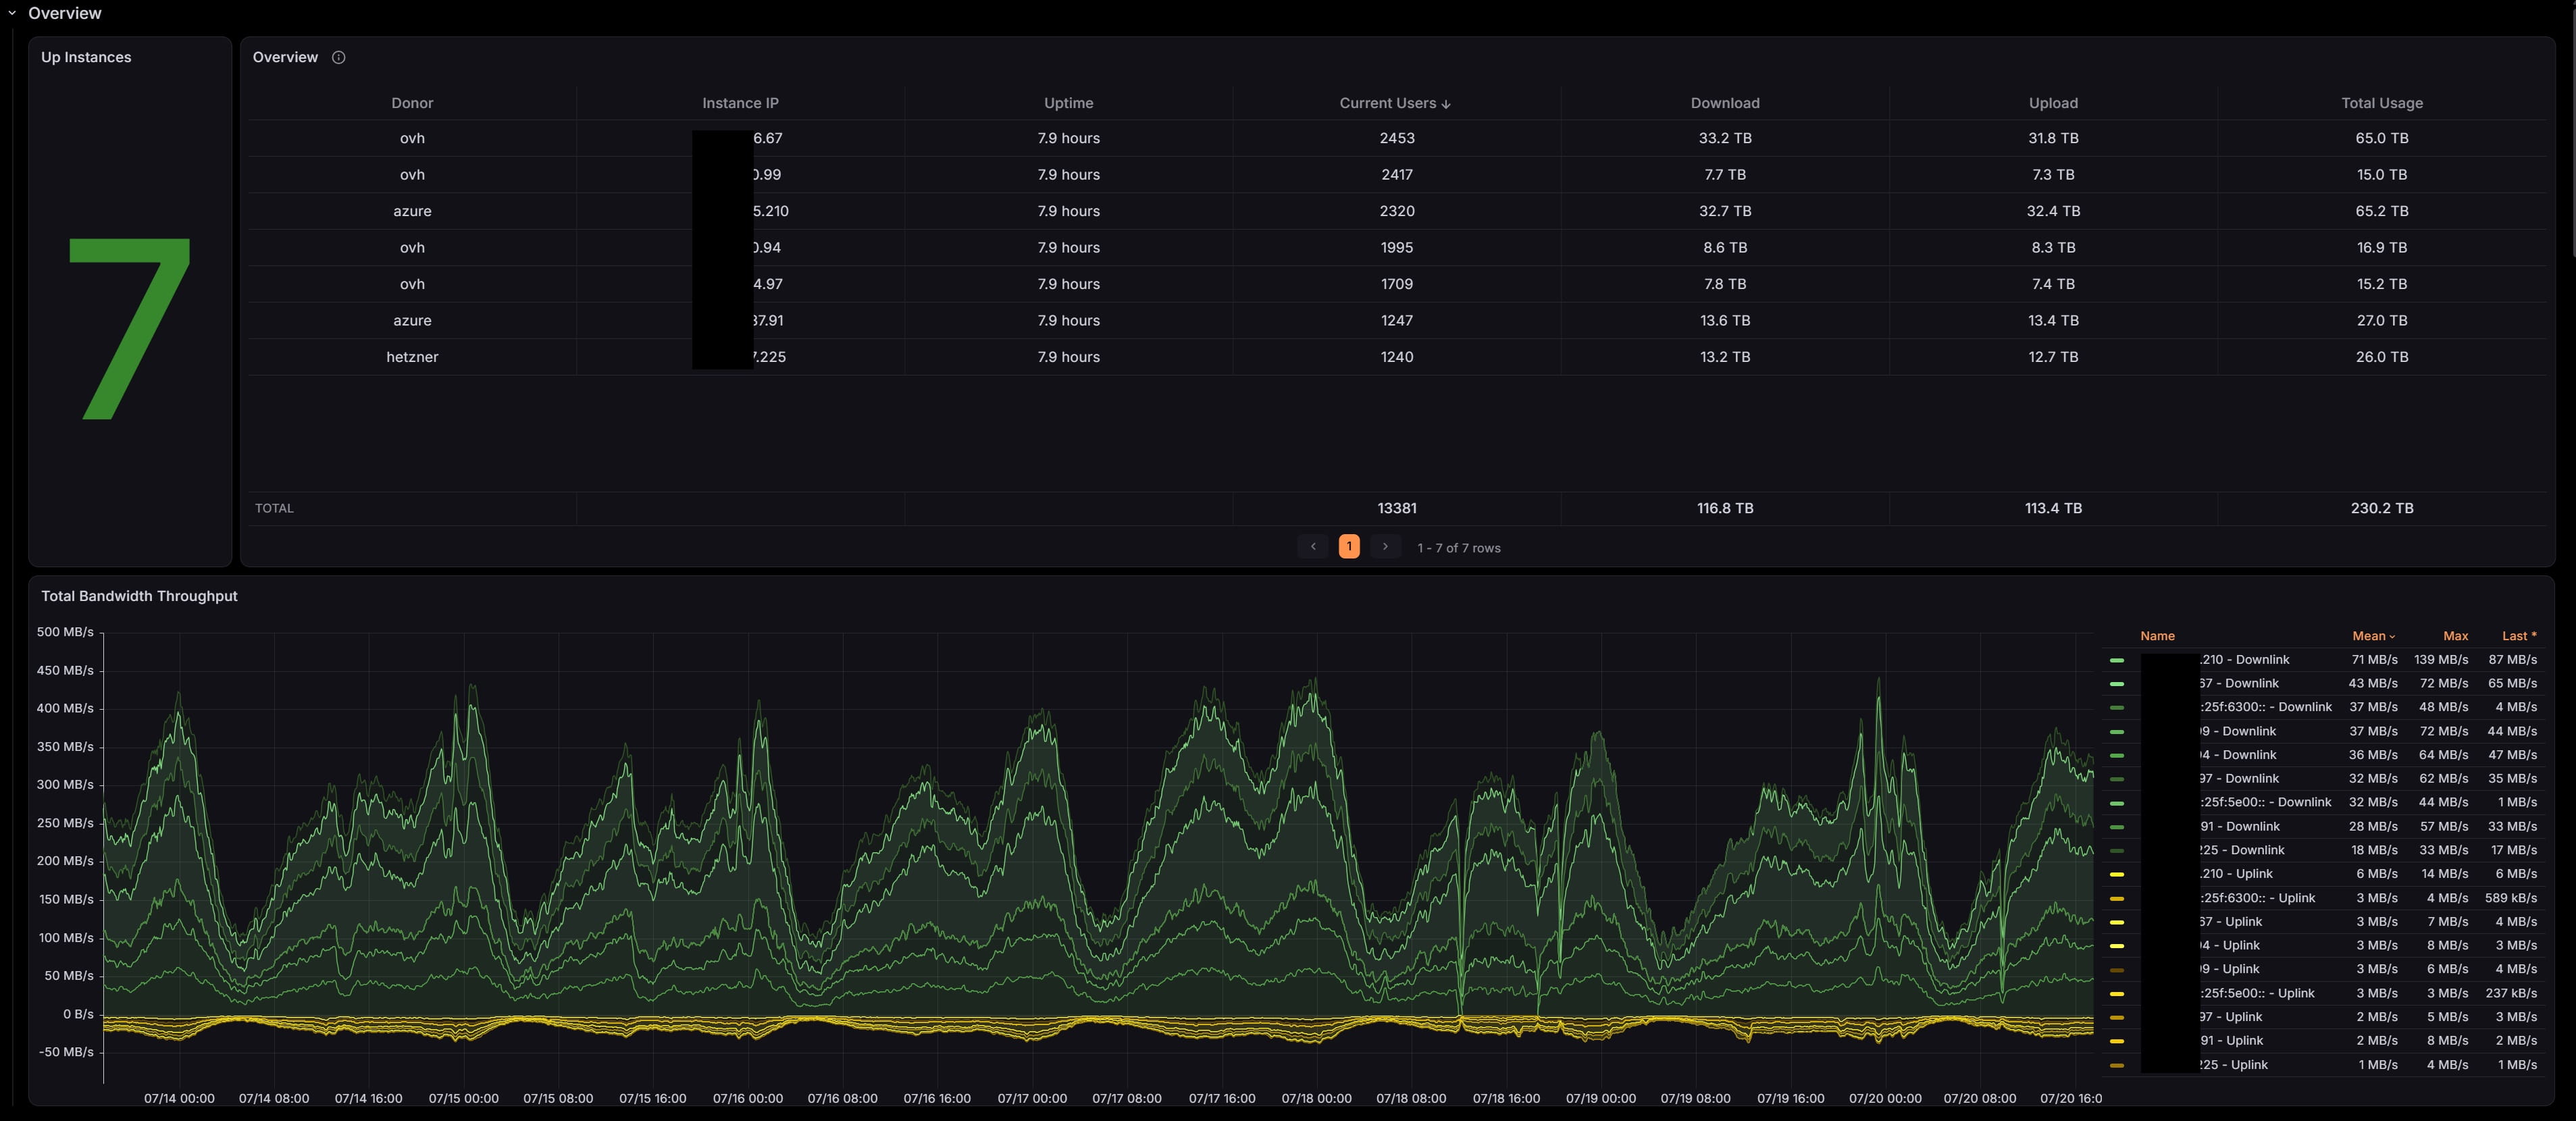
Overview
- Up instances (servers currently reporting)
- Total bandwidth throughput (up and down across inbounds)
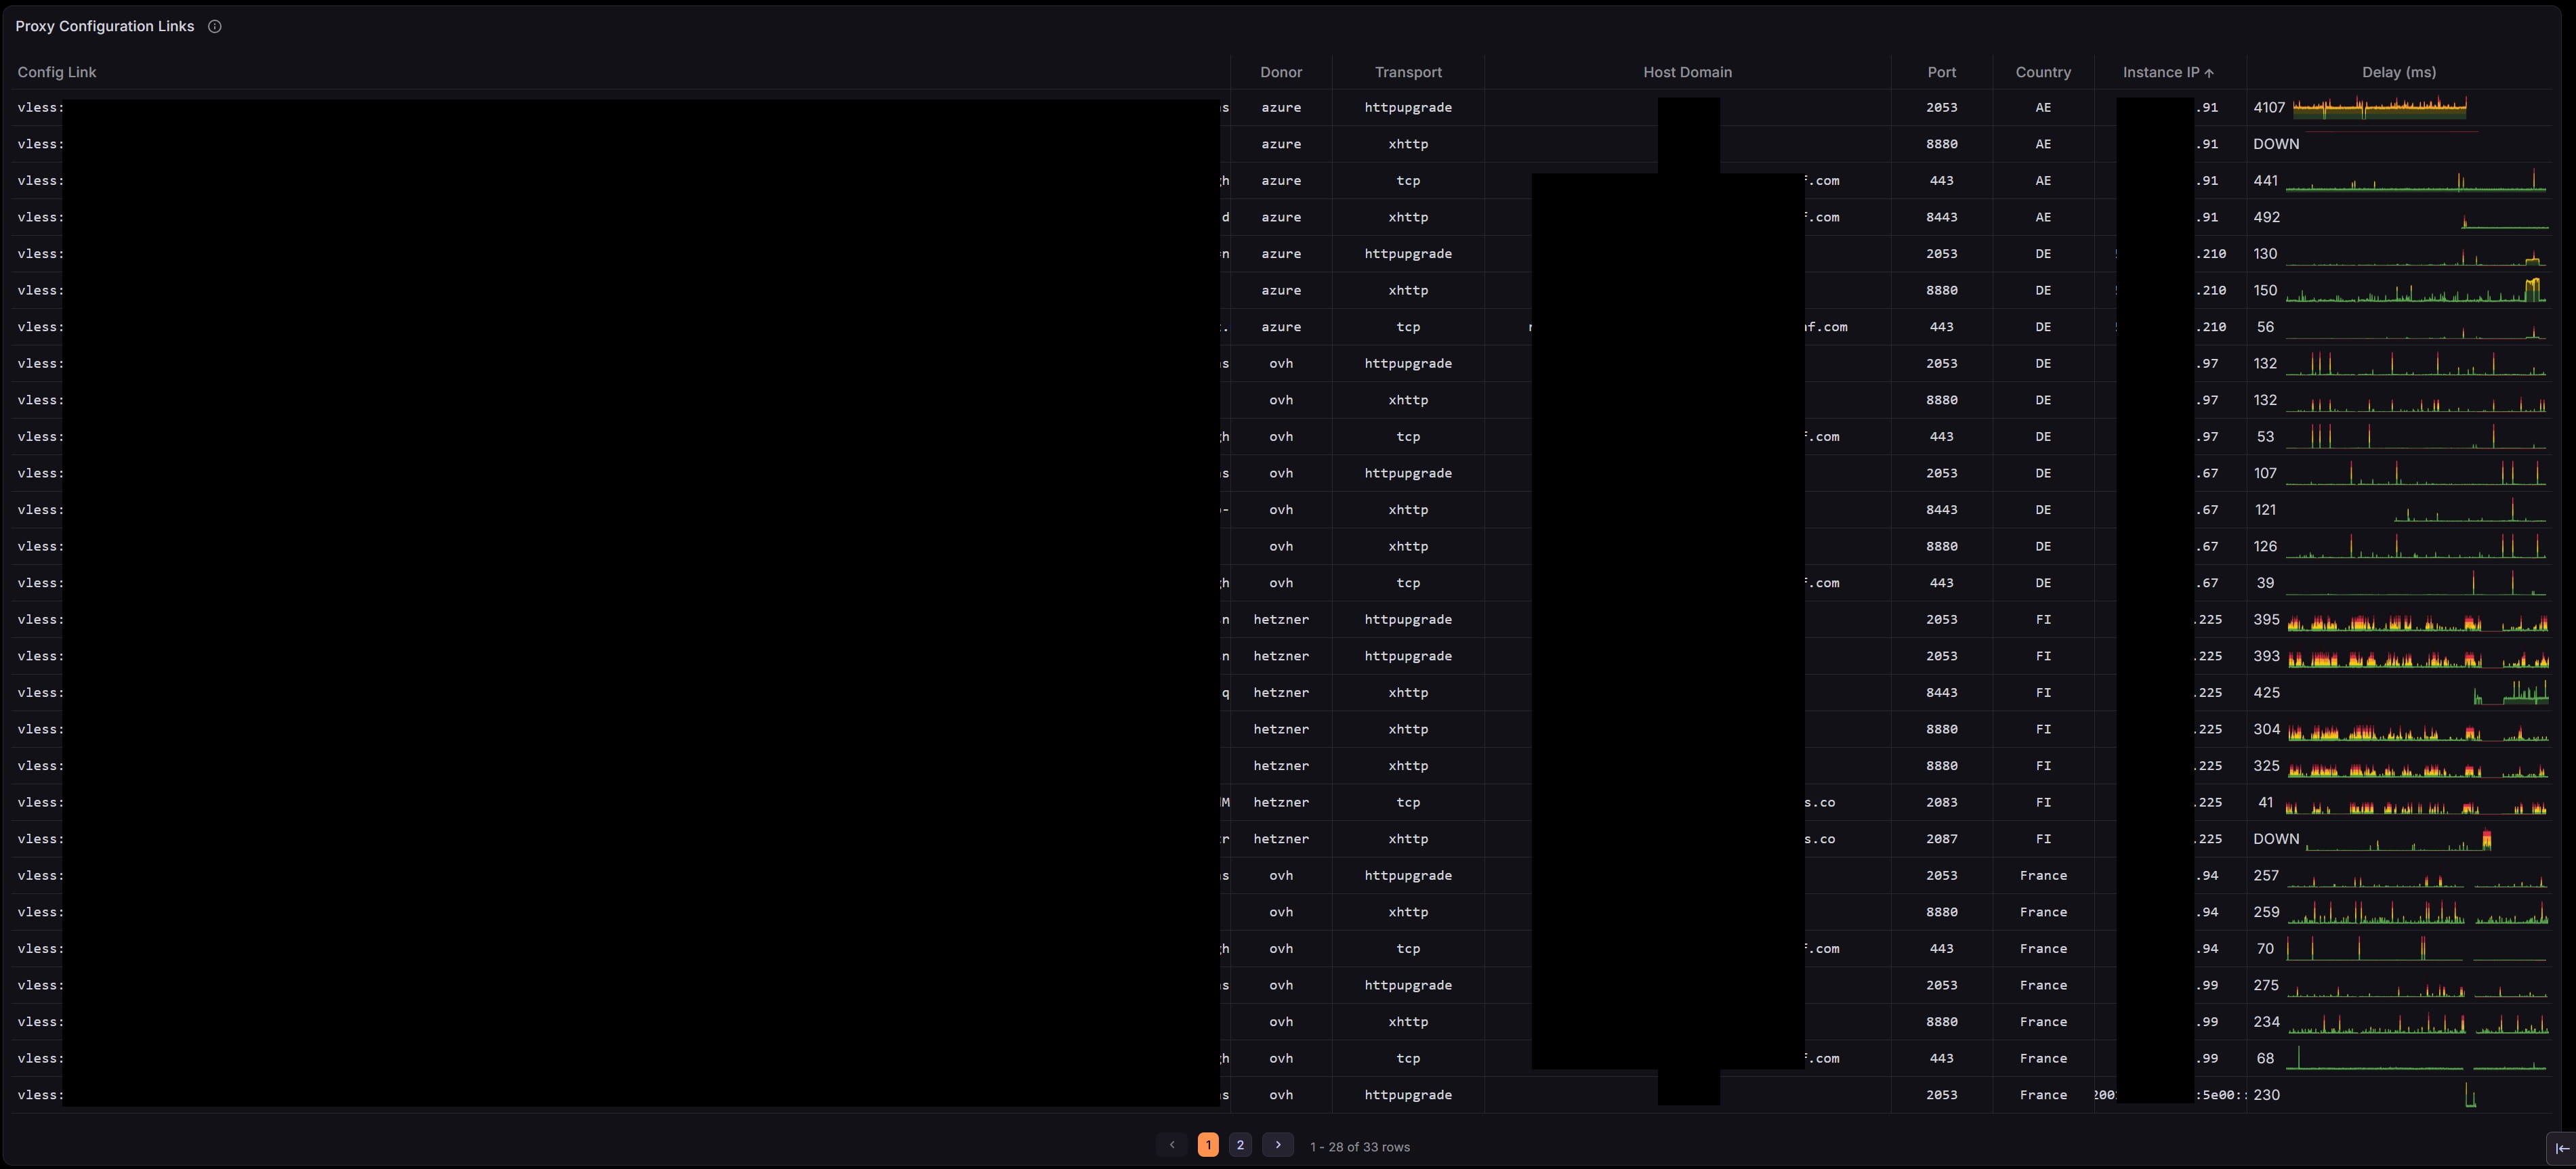
- Proxy configuration links: per-config reachability and latency as a trend sparkline, with DOWN detection
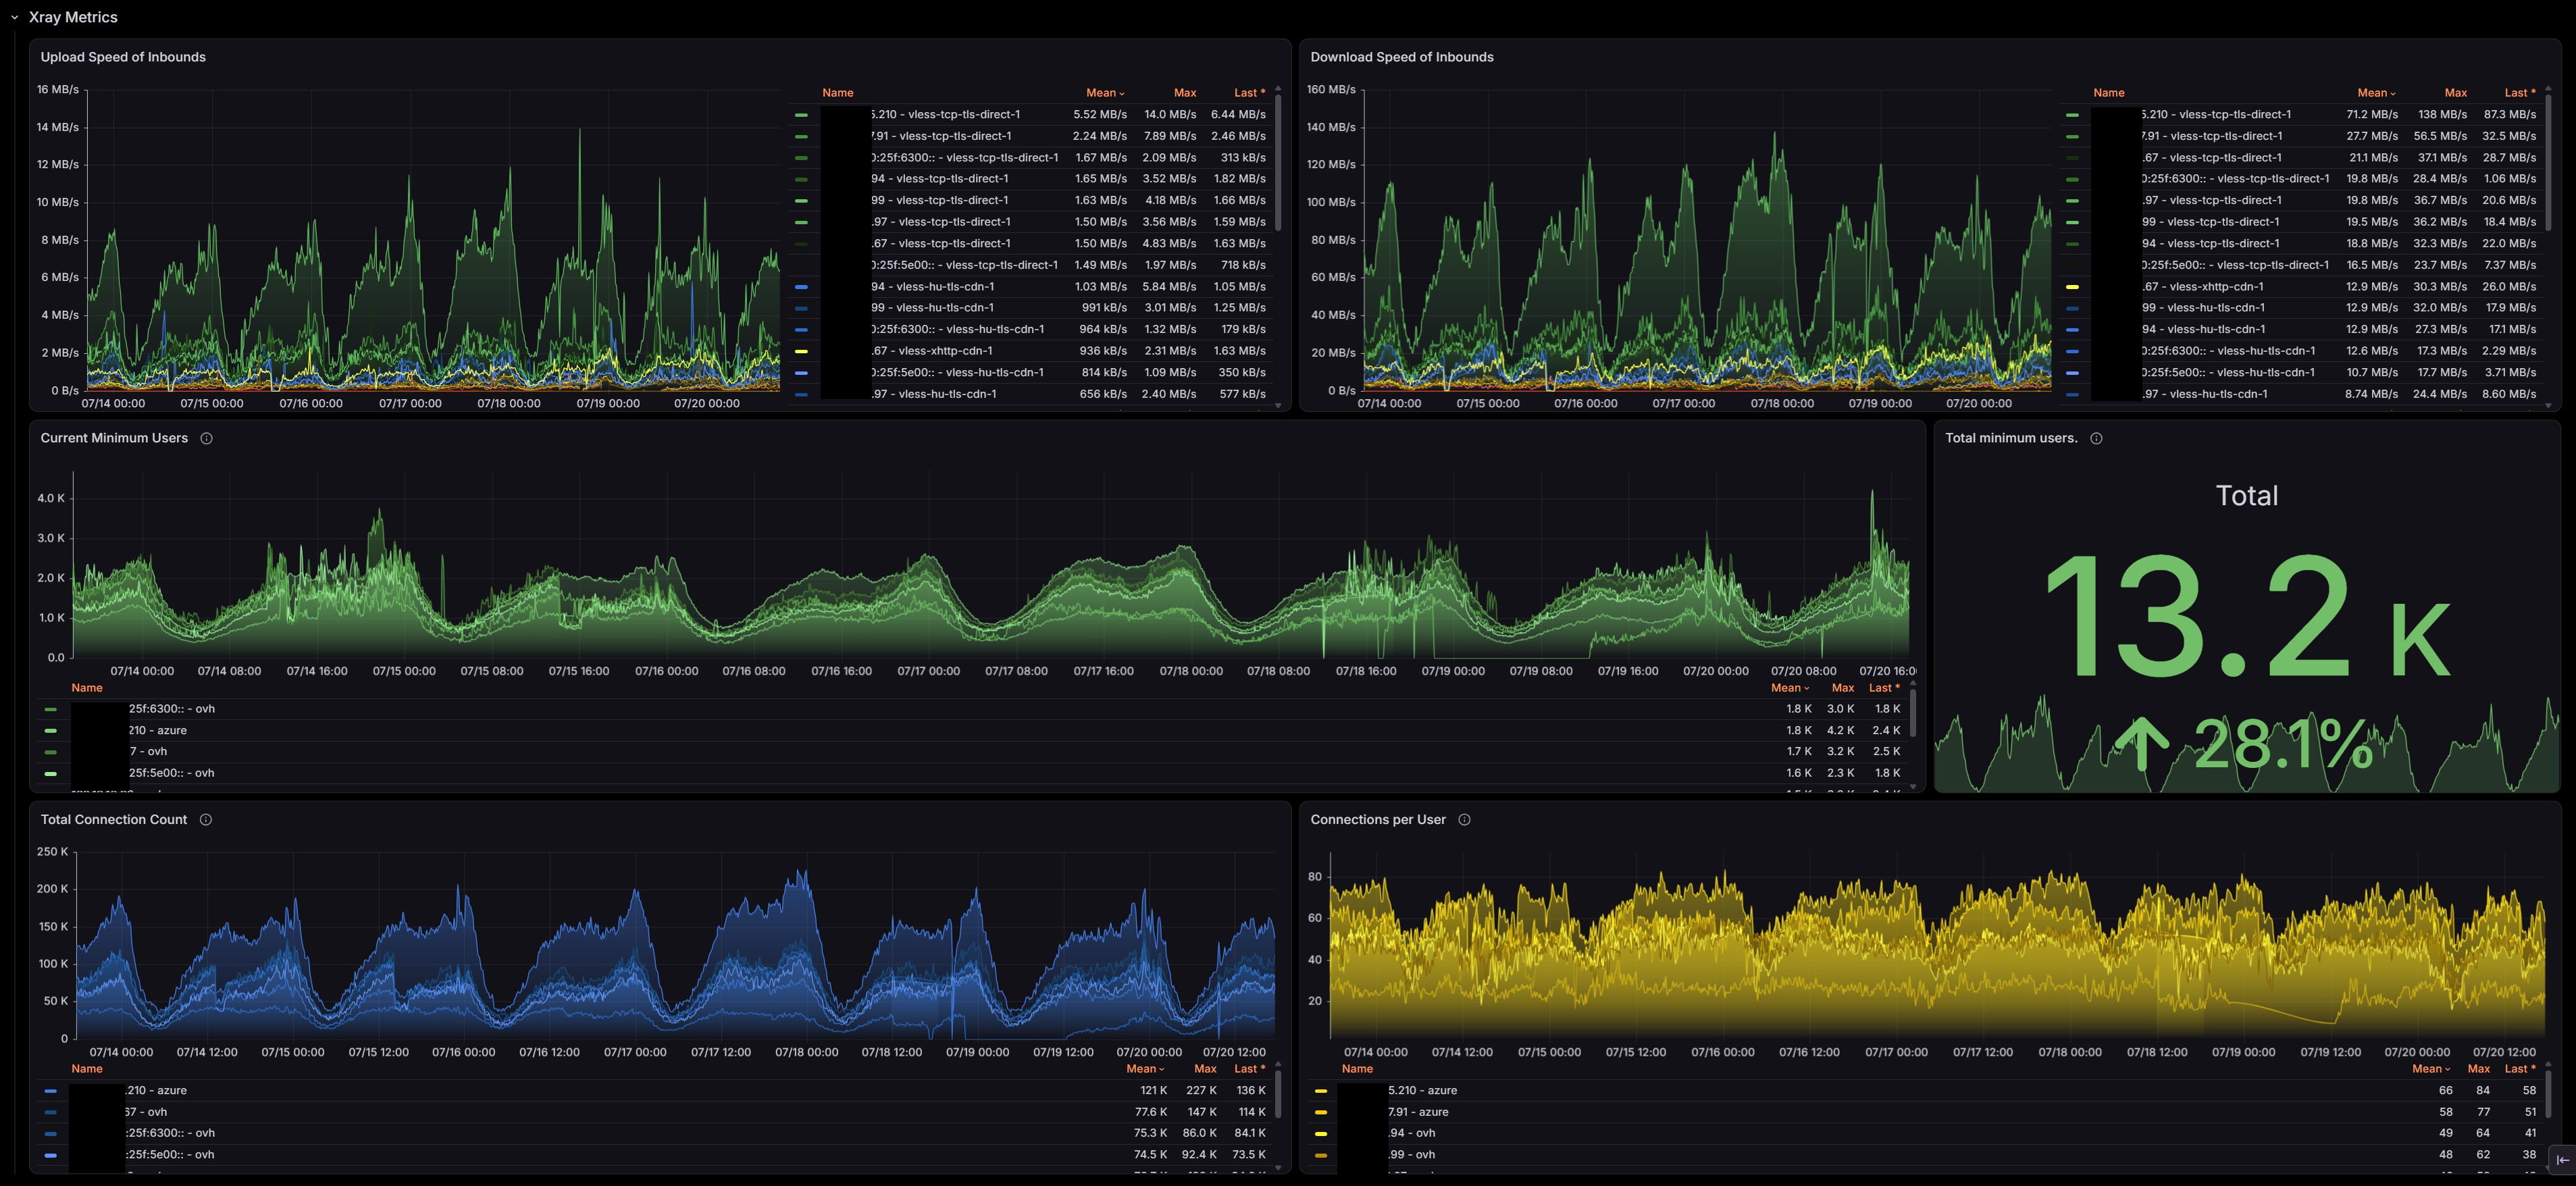
Xray metrics
- Upload and download speed per inbound
- Unique active users (current and total)
- Total connection count and connections per user
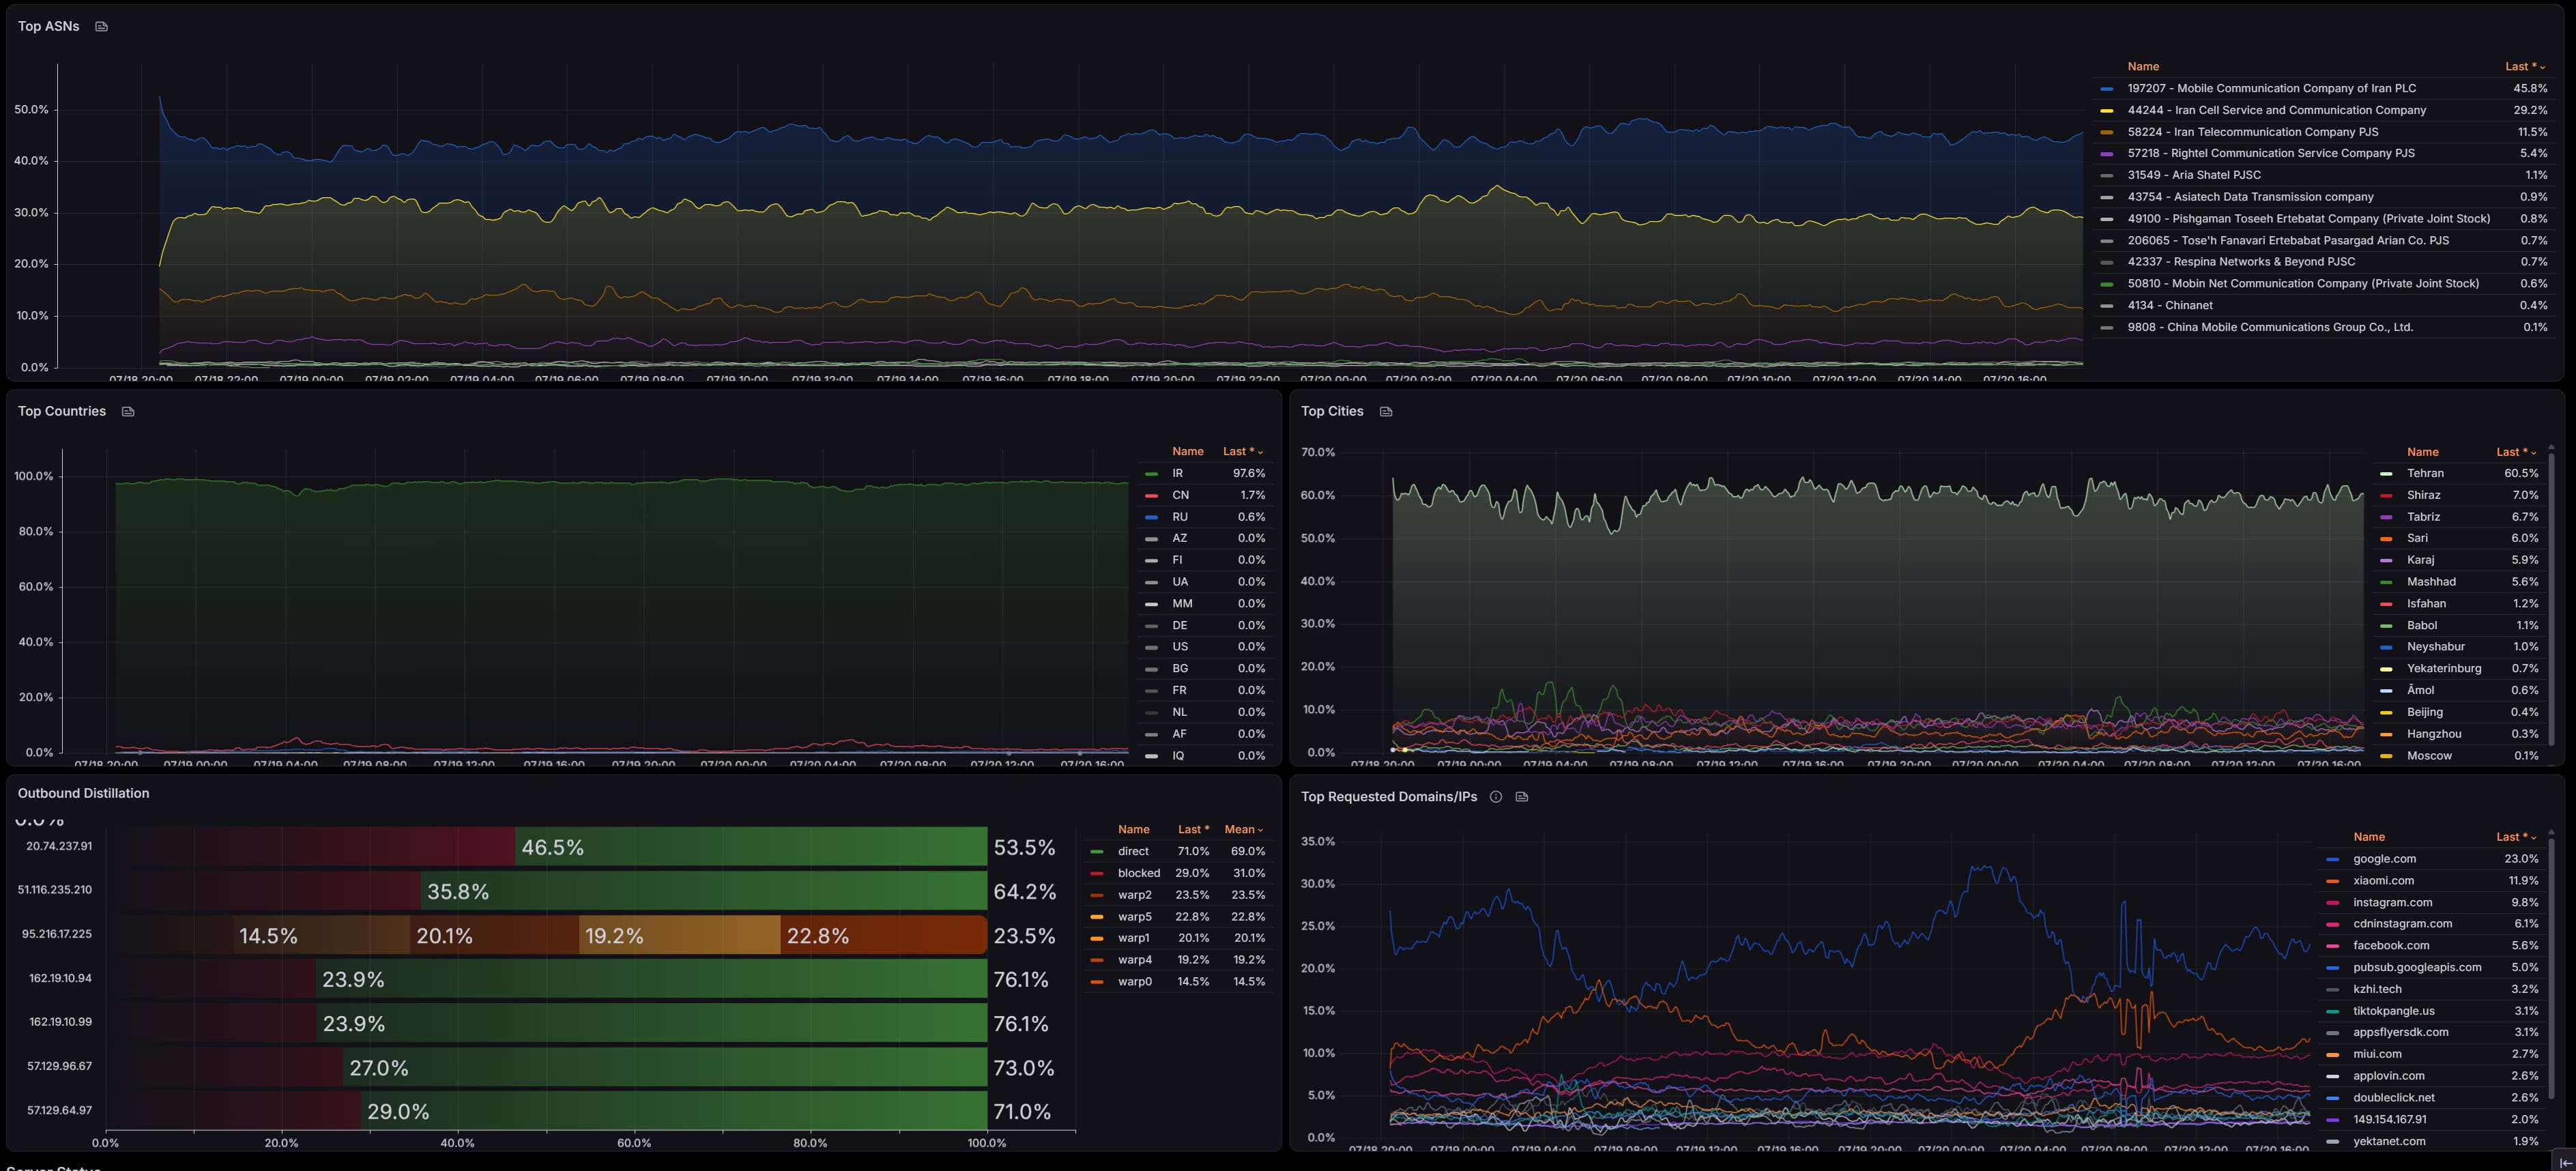
Routing analytics
- Top ASNs, countries, and cities by traffic share
- Outbound distribution (how requests are routed)
- Top requested domains and IPs
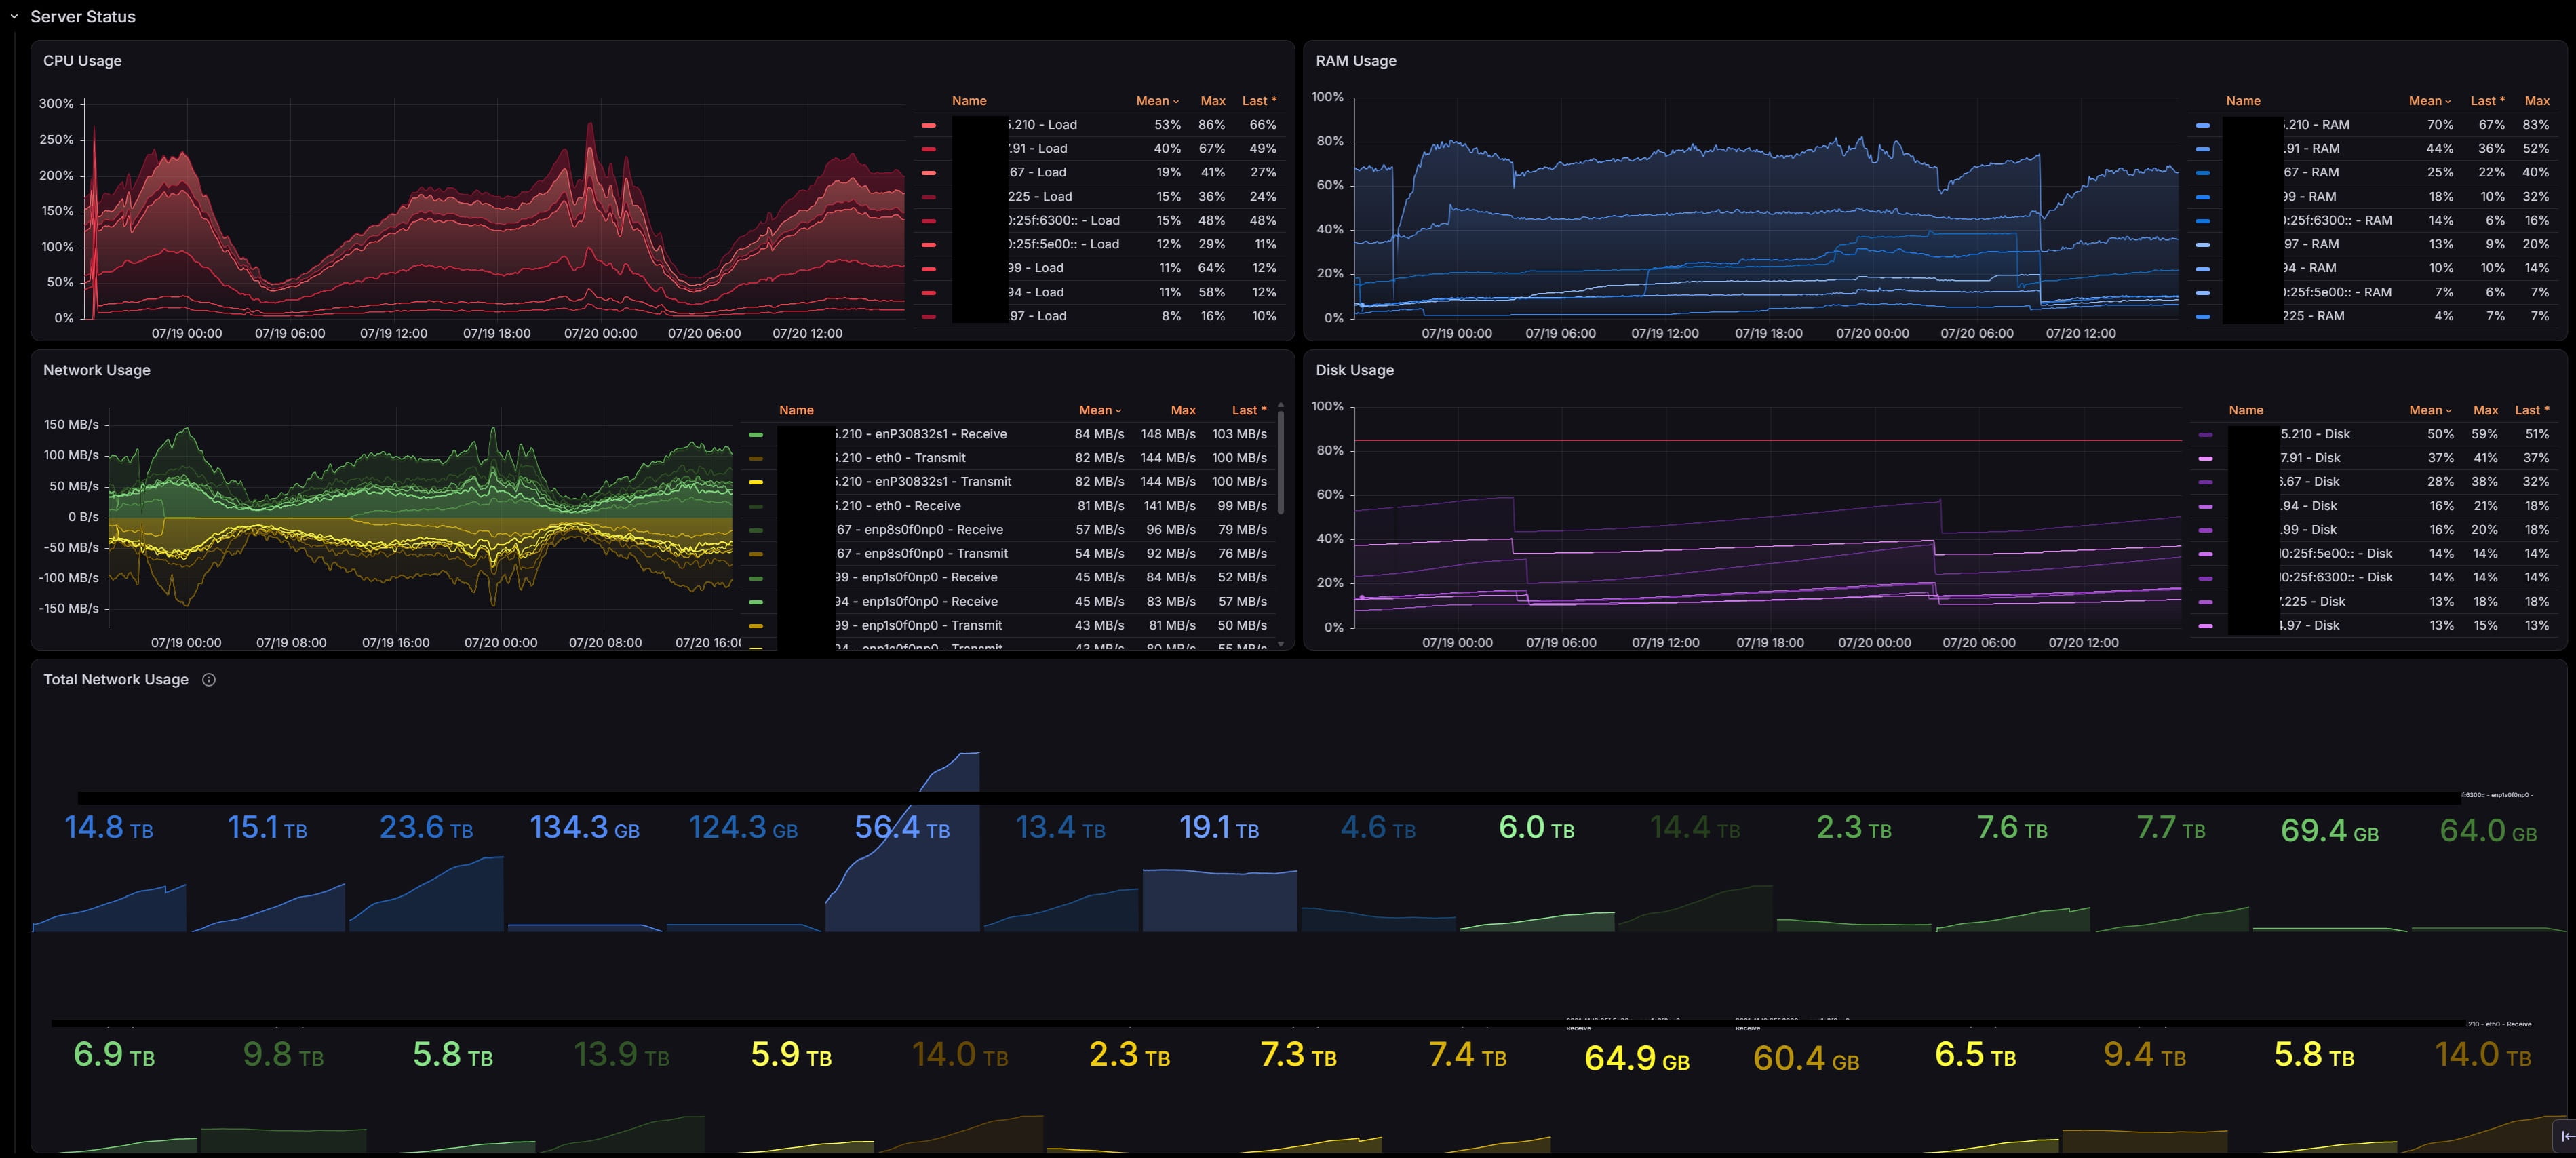
Server status
- CPU, RAM, and disk usage per server (percent)
- Per-interface network usage and total network usage
Requirements
- Grafana v10.1 or later (uses the time-series-to-table transform and sparkline table cells)
- A Prometheus-compatible data source
- node_exporter for system metrics
- Xray with xray-exporter for traffic, user, and routing metrics
- The CompassVPN agent, which emits the
vpn_configlink-health metric
Installation
- Import this dashboard into Grafana (Dashboards > New > Import).
- Select your Prometheus data source when prompted.
- Deploy the CompassVPN agent on your servers so the expected metrics are present.
Data collection
All series arrive through Prometheus. The CompassVPN agent runs Xray, xray-exporter, and node_exporter on each server and forwards metrics via Grafana Alloy (remote_write). Config reachability and latency (vpn_config) come from the agent's own test cycle.
Refresh and intervals
- Dashboard refresh: 5 minutes (minimum selectable), matching the agent's test cycle
- Scrape interval: 5 minutes, so rate windows are sized accordingly
- History retention: depends on your Prometheus or Cloud settings
Template variables
- Donor: filter to a provider. Defaults to All.
- Instance: filter to one or more servers. Defaults to All.
License
Part of the CompassVPN project. See the project repositories for license terms.
For docs and updates, see compassvpn.org.
Data source config
Collector config:
Upload an updated version of an exported dashboard.json file from Grafana
| Revision | Description | Created | |
|---|---|---|---|
| Download |