Dotnet Runtime Metrics
Runtime metrics for .NET applications using either .NET 9+ built-in metrics or OpenTelemetry.Instrumentation.Runtime package (for .NET 6/7/8). CPU metrics require .NET 9+.
.NET Runtime Dashboard
This Grafana dashboard provides comprehensive monitoring of .NET Core runtime metrics, giving you deep insights into your application's performance, memory management, threading, and exception handling.
Source Code
Source code for this dashboard is available at: https://github.com/petabridge/dotnet-grafana-dashboards/blob/master/runtime/README.md
Features
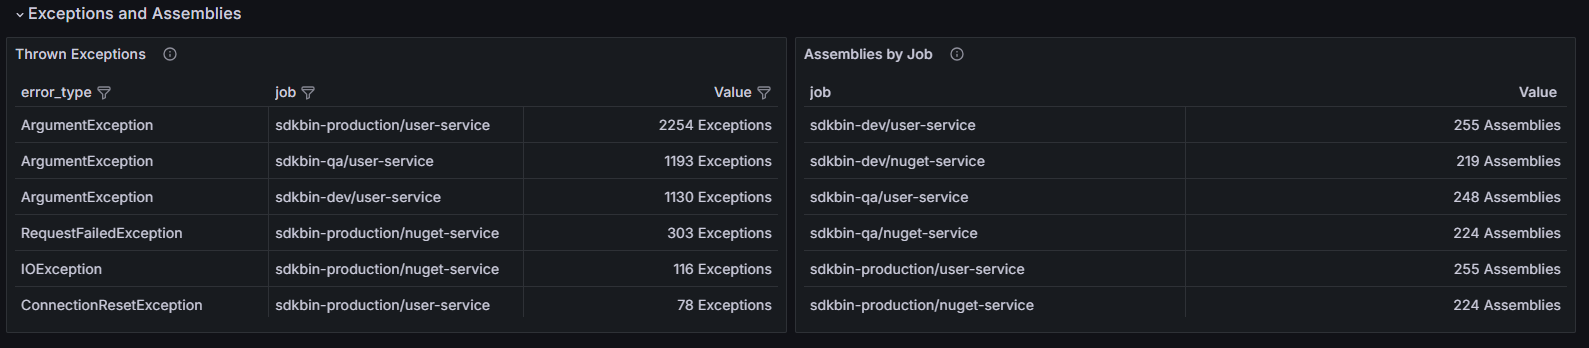
- Exception Monitoring: Track both handled and unhandled exceptions
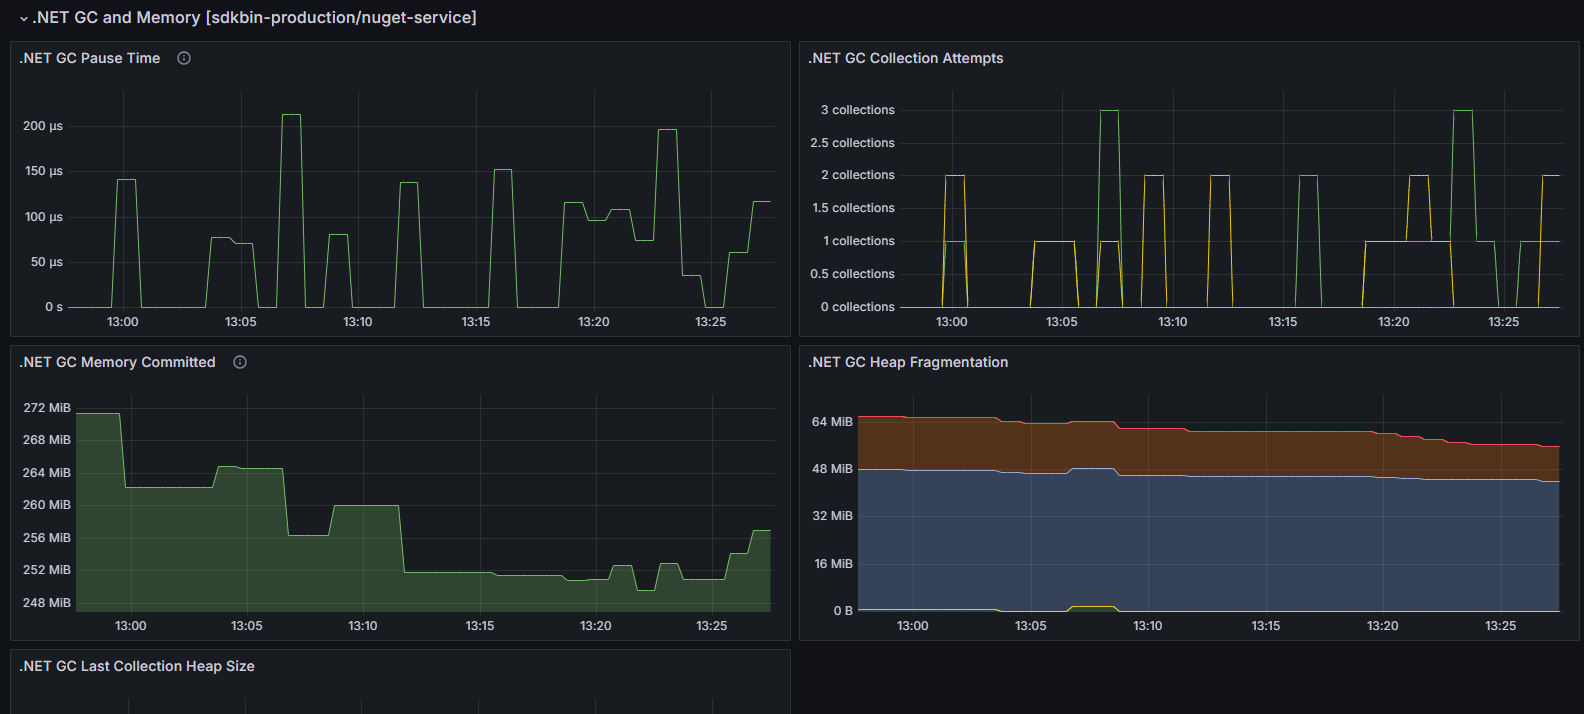
- Garbage Collection: Monitor GC performance, heap sizes, and collection frequencies
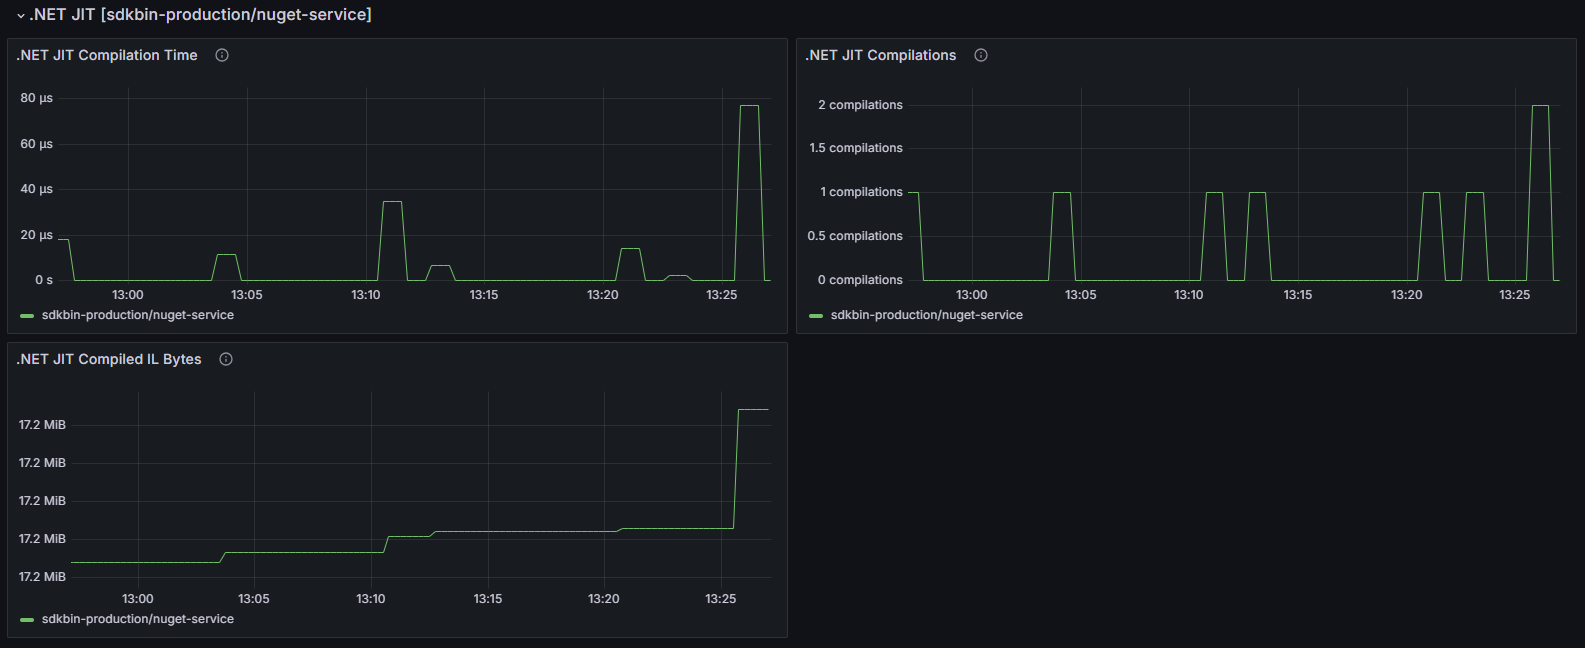
- JIT Compilation: Track JIT compilation times and methods
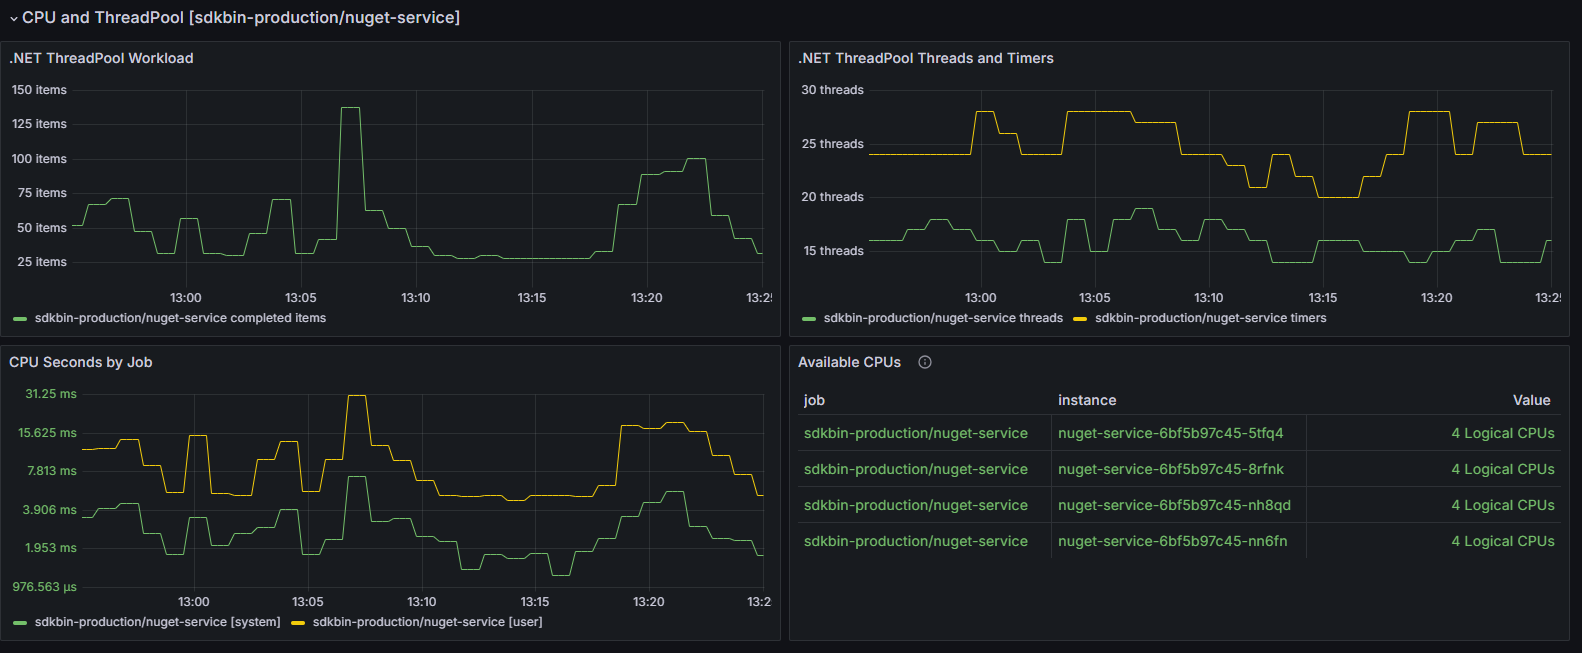
- ThreadPool: Monitor thread pool utilization and CPU usage
- Assembly Loading: Track loaded assemblies and loading times
- Memory Usage: Monitor detailed memory metrics across different generations
Prerequisites
To use this dashboard, you need to have the following OpenTelemetry.Instrumentation.Runtime package installed in your .NET application:
<ItemGroup>
    <PackageReference Include="OpenTelemetry.Instrumentation.Runtime" Version="{version}" />
</ItemGroup>
This dashboard is designed to work with Prometheus and the OTLP Exporter.
var builder = WebApplication.CreateBuilder(args);
builder.Services.AddOpenTelemetry()
.WithMetrics(metrics =>
{
metrics
// OTHER METRICS SOURCES
.AddRuntimeInstrumentation();
})
// traces, et al
.UseOtlpExporter();
var app = builder.Build();
Installation
Import the dashboard into Grafana from Grafana Cloud: https://grafana.com/grafana/dashboards/23179
Import the dashboard into Grafana as a JSON file:
- Open Grafana
- Navigate to Dashboards > Import
- Click "Upload JSON file"
- Select the
dotnet-runtime-dashboard.jsonfile - Select your Prometheus data source
- Click "Import"
Metrics Explanation
Exception Metrics
- Total exceptions thrown
- Exception types and frequencies
- Exception rate over time
GC Metrics
- GC collection counts by generation
- GC pause times
- Heap sizes
- Memory allocation rates
JIT Metrics
- Methods JIT compiled
- JIT compilation times
- Assembly loading metrics
ThreadPool Metrics
- Thread pool queue length
- Thread count
- Thread pool completion rate
- CPU usage per thread
Data source config
Collector config:
Upload an updated version of an exported dashboard.json file from Grafana
| Revision | Description | Created | |
|---|---|---|---|
| Download |