Azure / Insights / Containers / Networking / Flow Logs - Basic Tier
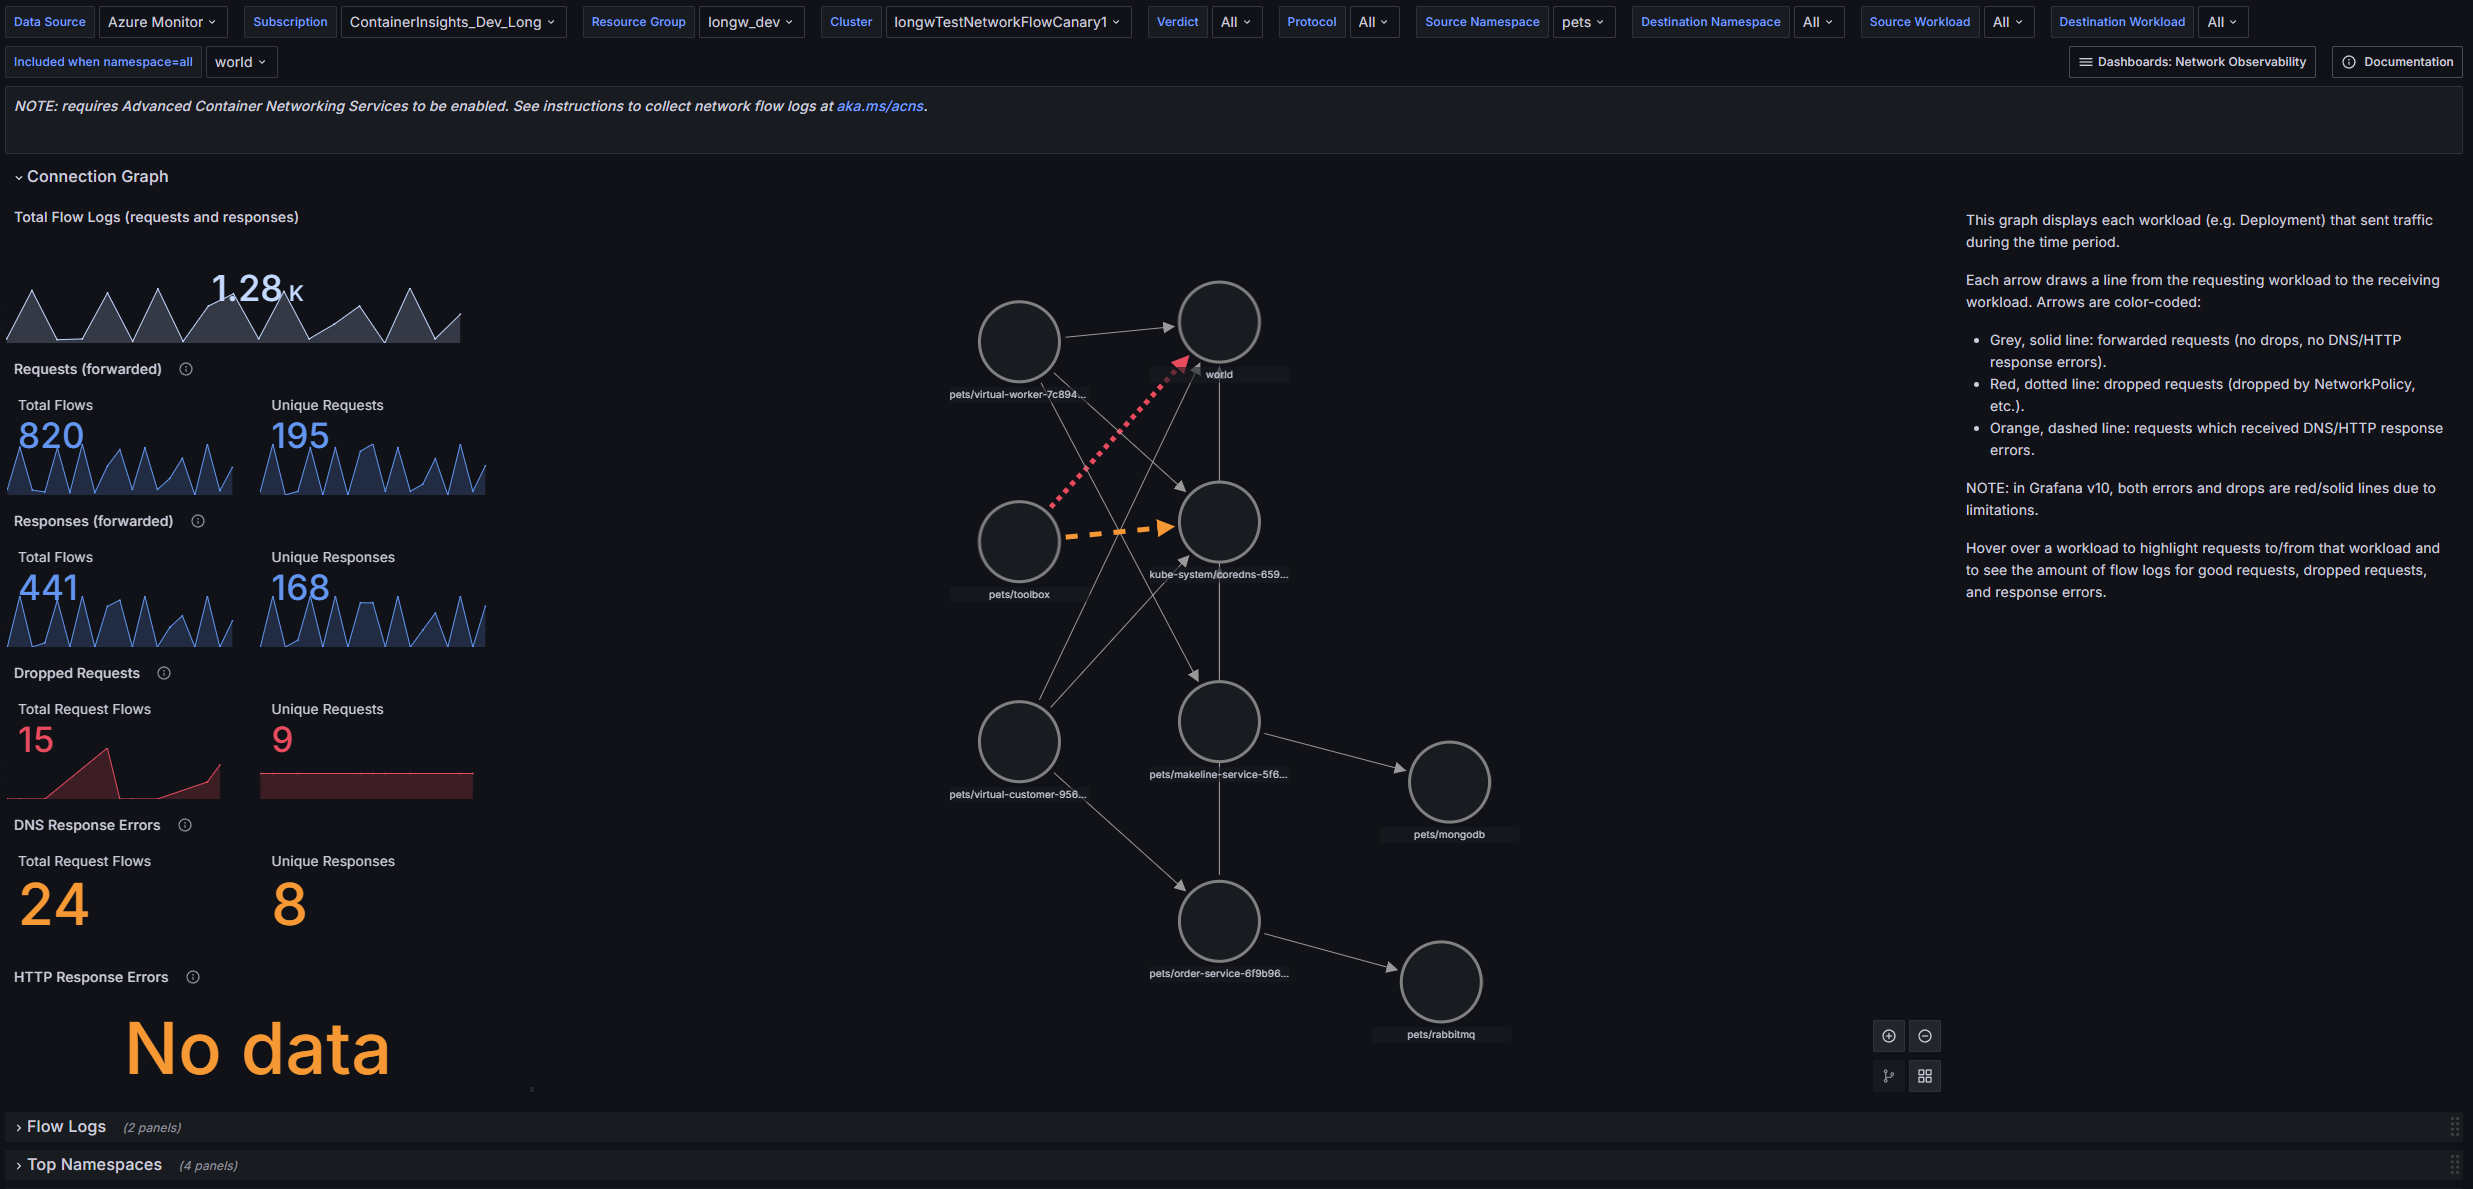
Container network flow logs dashboard for monitoring network traffic, connections, and policies in Kubernetes clusters. For use with Basic Tier logs. Requires Advanced Container Networking Services (ACNS) to be enabled for flow log collection.
This dashboard provides visualizations into which Kubernetes workloads are communicating with each other, including network requests, responses, drops, and errors.
NOTE: requires Advanced Container Networking Services to be enabled. Additionally, users must configure collection of network flow logs. See aka.ms/acns for more info.
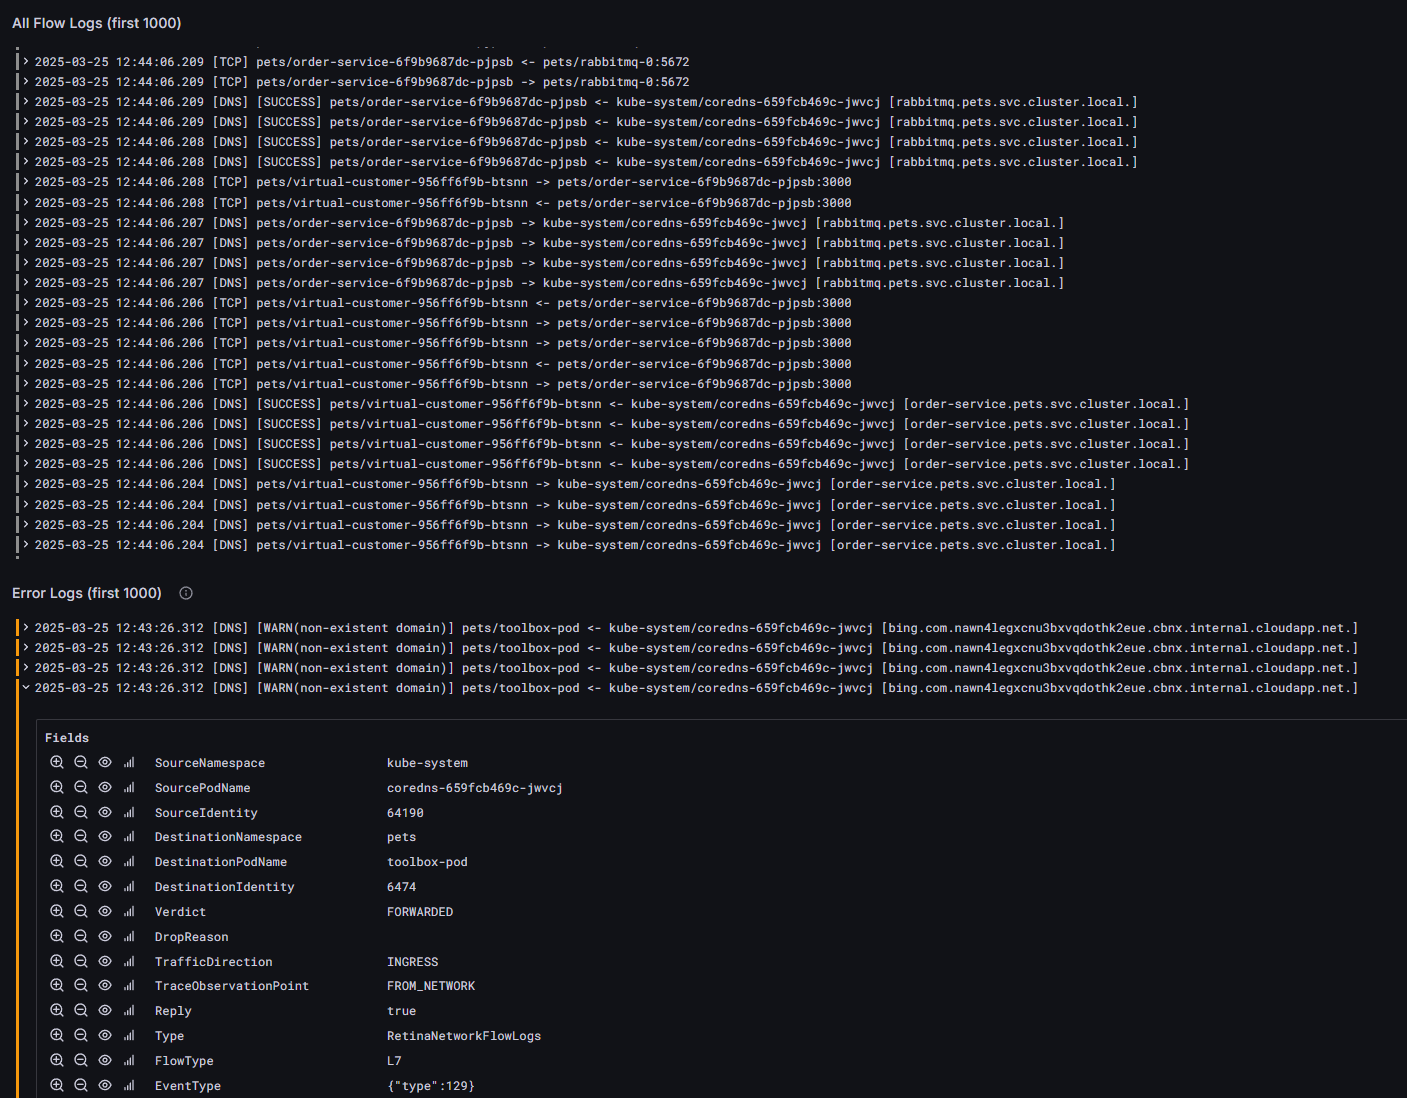
The service graph displays the cluster's network topology, surfacing drops and errors. A view for raw flow logs provides detailed info and timestamps.
Users can filter on namespaces, Deployments, etc. as well as protocols and more.
Summary panels surface top namespaces, workloads, DNS queries, etc. regarding requests, responses, drops, and errors.
Data source config
Collector config:
Upload an updated version of an exported dashboard.json file from Grafana
| Revision | Description | Created | |
|---|---|---|---|
| Download |
Azure Cosmos DB
With the Grafana plugin for Azure Cosmos DB, you can quickly visualize and query your Azure Cosmos DB data from within Grafana.
Learn more


