Kubernetes / Networking / L7 (Workload)
One of the dashboards dedicated to L7 traffic info within a given workload
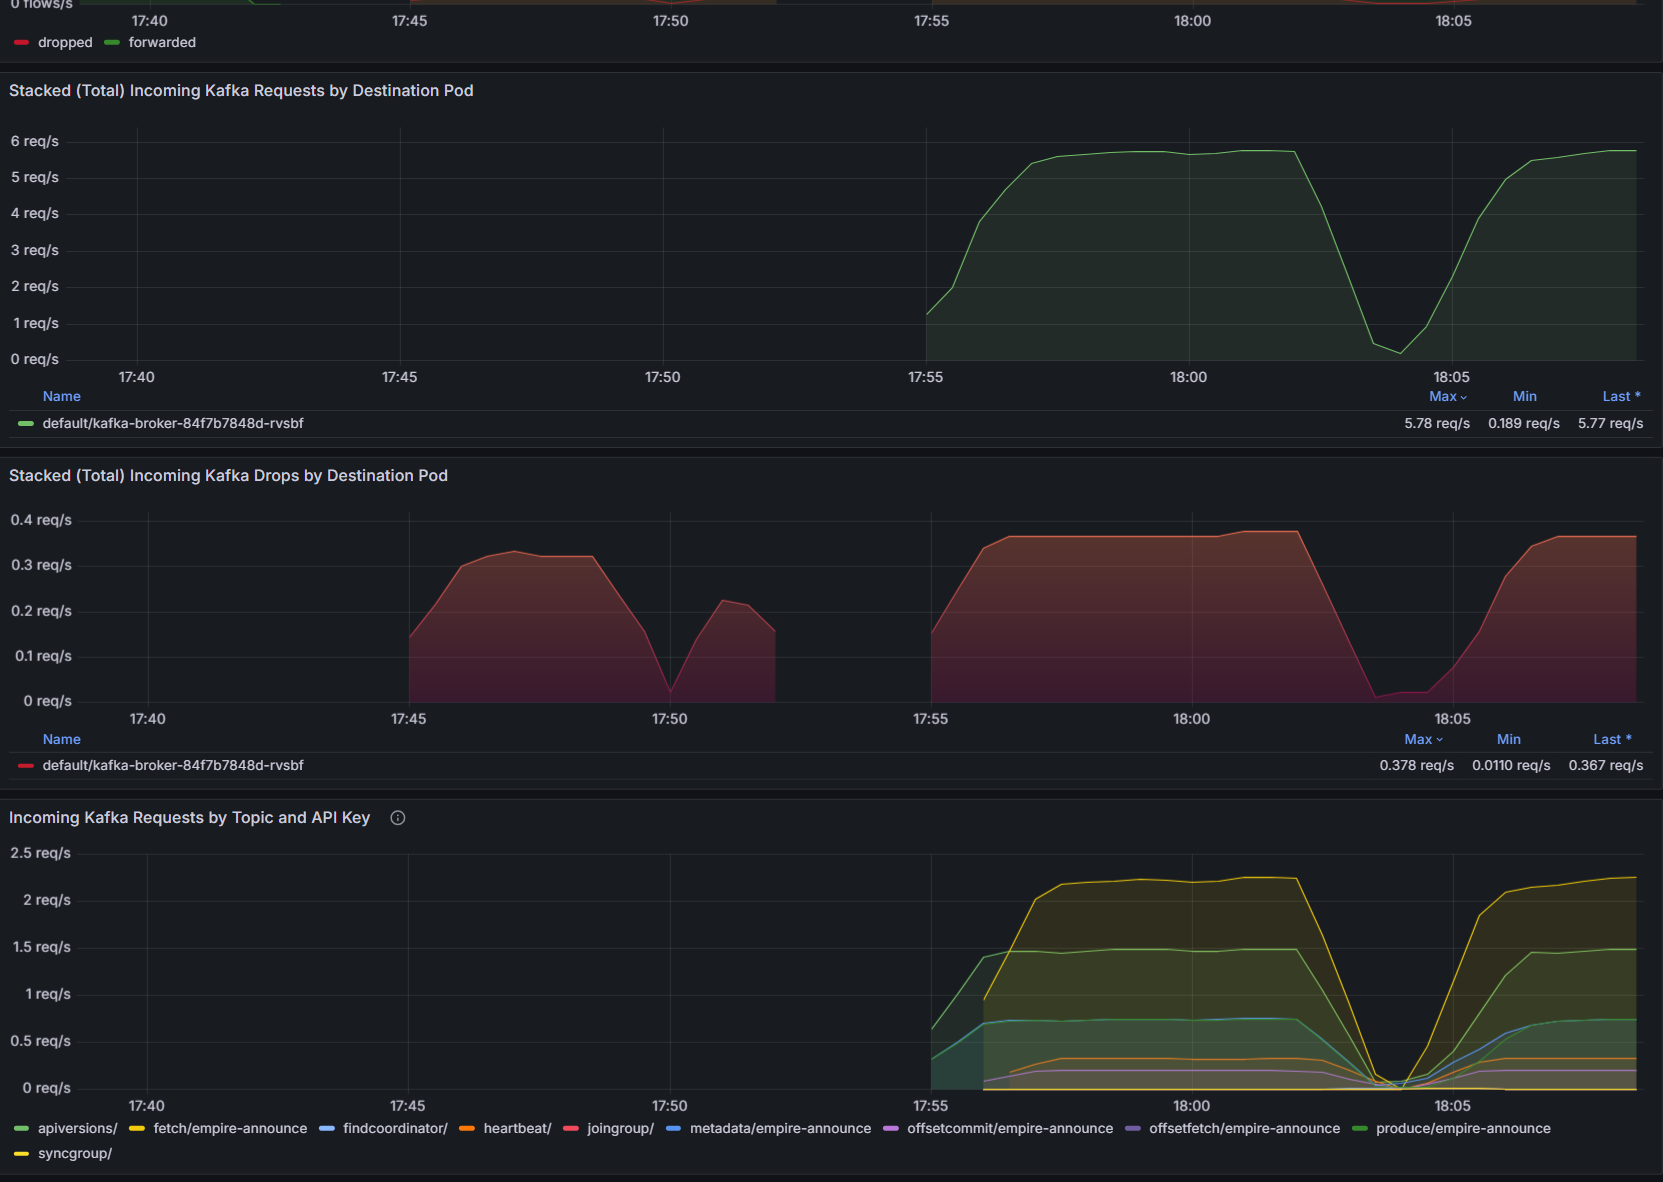
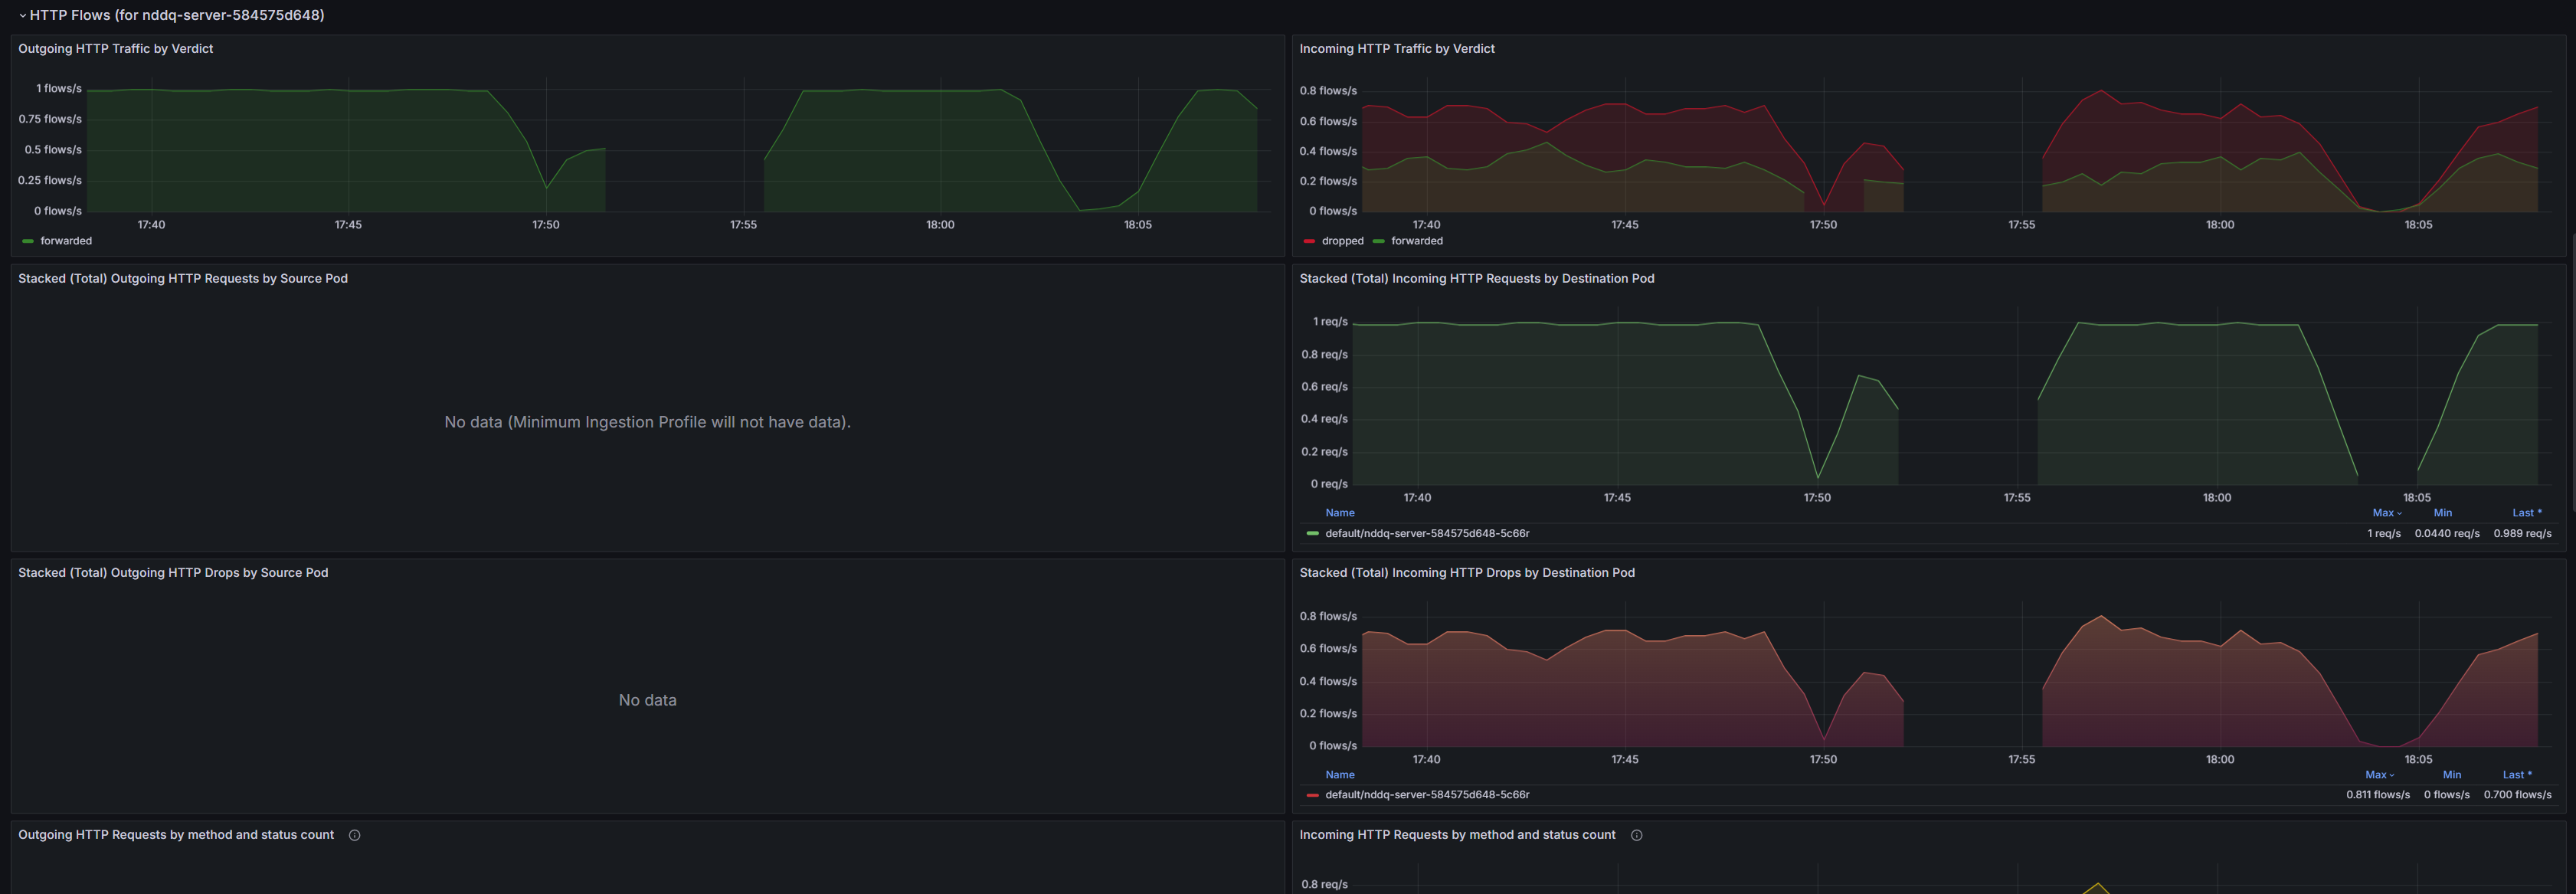
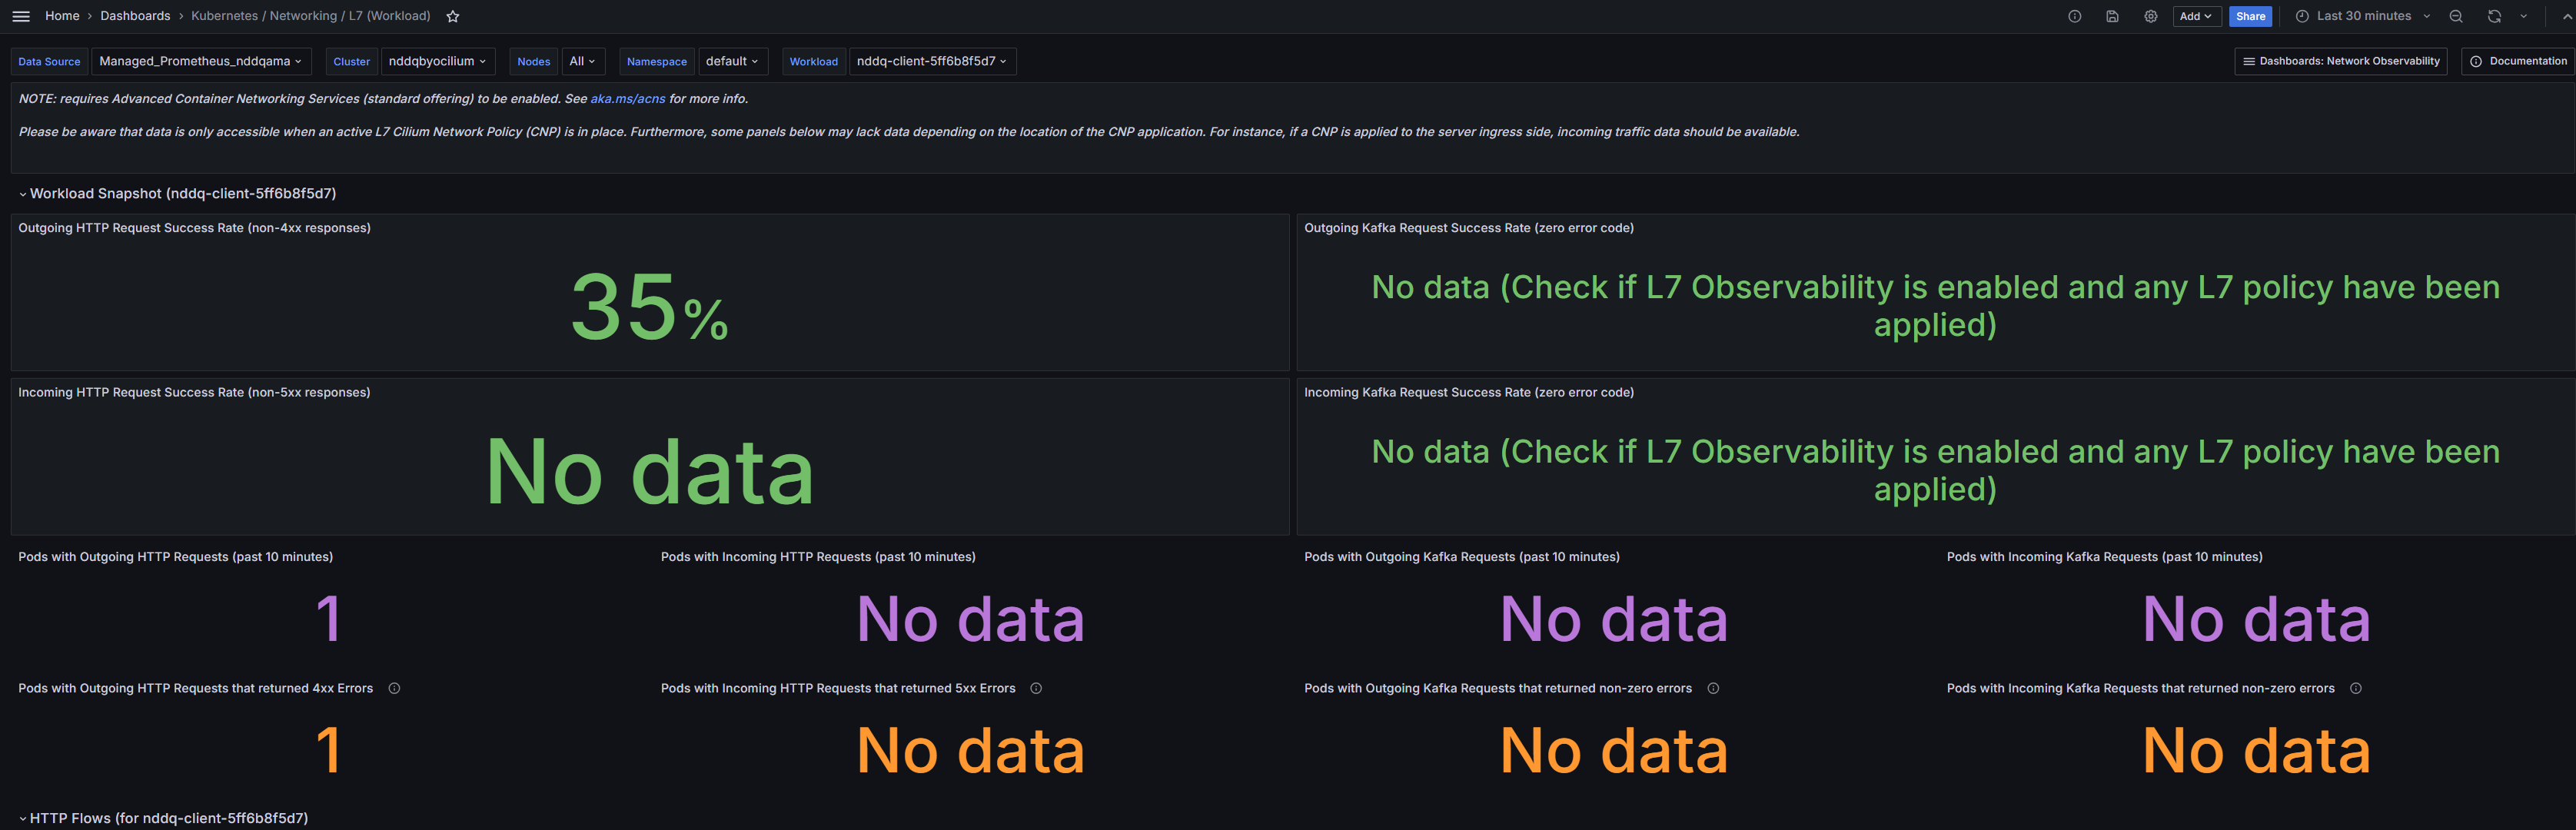
The Kubernetes / Networking / L7 (Workload) dashboard uses the prometheus data source to create a Grafana dashboard with the stat, text and timeseries panels.
Data source config
Collector type:
Collector plugins:
Collector config:
Revisions
Upload an updated version of an exported dashboard.json file from Grafana
| Revision | Description | Created | |
|---|---|---|---|
| Download |
Kubernetes
Monitor your Kubernetes deployment with prebuilt visualizations that allow you to drill down from a high-level cluster overview to pod-specific details in minutes.
Learn more