Glowroot Exporter Dashboard
Glowroot Exporter Dashboard – JVM Performance at a Glance 🚀
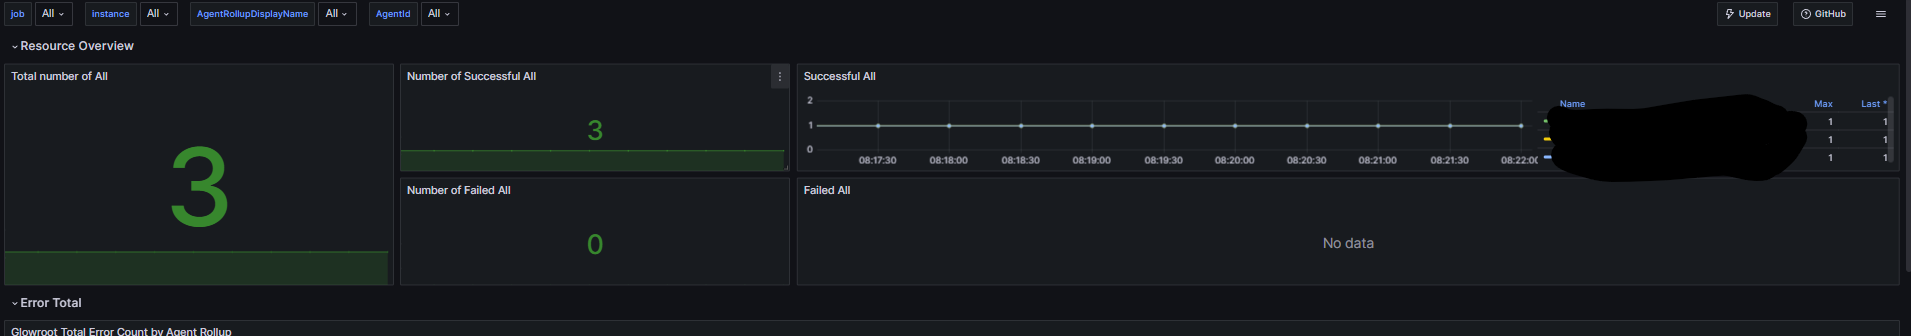
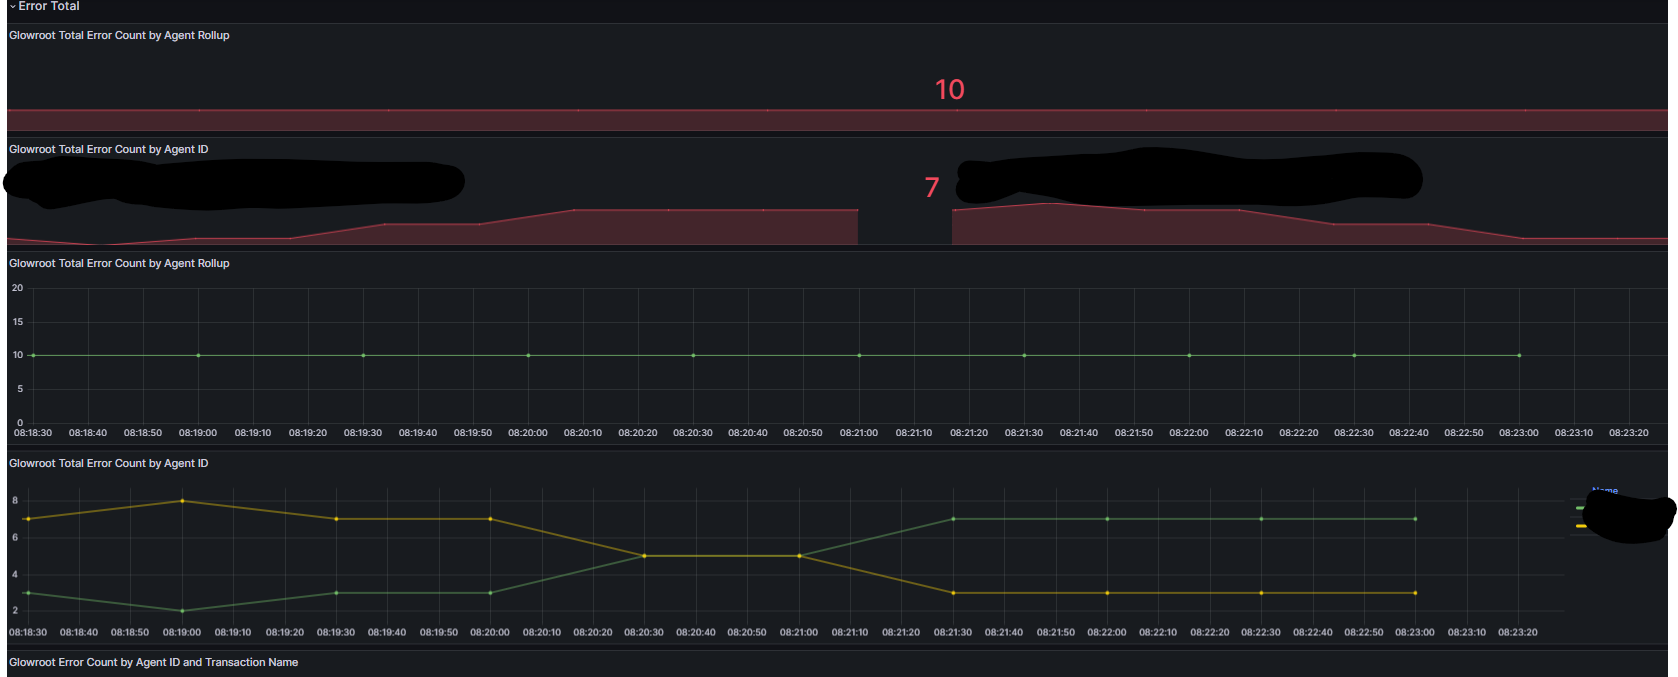
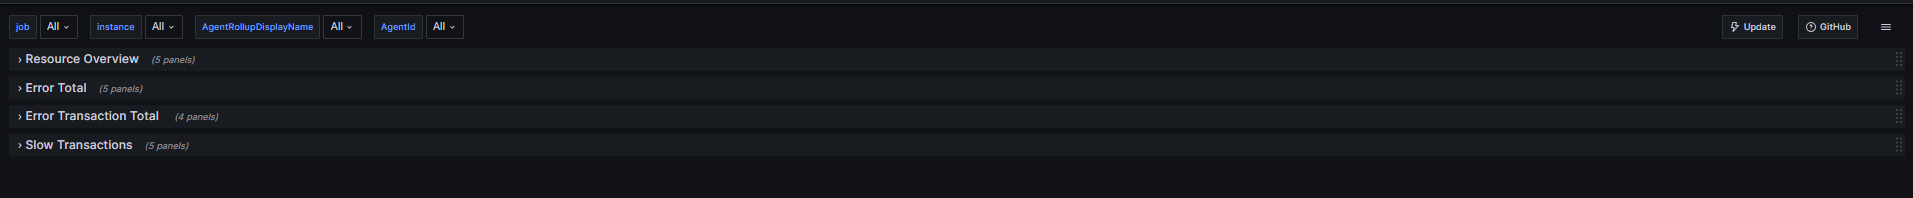
Glowroot Exporter Dashboard – JVM Performance at a Glance 🚀
A Prometheus exporter for Glowroot APM metrics, designed to provide real-time insights into your JVM performance. This exporter collects transaction and error metrics from Glowroot and exposes them in Prometheus format, making it easy to visualize data in Grafana.
Key Features
- ✅ Collects detailed transaction and error metrics from Glowroot
- ✅ Supports agent rollups and child agents for better observability
- ✅ Configurable metrics update interval
- ✅ Exposes a Prometheus-compatible metrics endpoint
🔗 More Information & Source Code: GitHub Repository
This exporter helps you integrate Glowroot APM with Prometheus and Grafana, offering a seamless way to monitor JVM performance. 🚀
Data source config
Collector type:
Collector plugins:
Collector config:
Revisions
Upload an updated version of an exported dashboard.json file from Grafana
| Revision | Description | Created | |
|---|---|---|---|
| Download |