Autopilot Metrics
This dashboard displays Nodes health and utilization
This dashboard exports metrics created by Autopilot.
Autopilot is a Kubernetes-native daemon that continuously monitors and evaluates GPUs, network and storage health, designed to detect and report infrastructure-level issues during the lifetime of AI workloads. It is an open-source project developed by IBM Research.
In AI training jobs, which may run for weeks or months, anomalies in the GPUs and network can happen anytime and often go undetected. In this case, performance degrades suddenly and a deep diagnostic is needed to identify the root cause, delaying or deleting the current job. Similarly, hardware anomalies can greatly disrupt the throughput and latency of an AI inference server.
The role of Autopilot is to detect and report any problems that are detected by its health checks during the lifetime of the job and the existence of a cluster.
It implements a set of health checks evaluating the status of the system. These health checks focus mainly on subtle/software issues (i.e., row-remapping or PCIe link degradation), but also run connectivity tests (i.e., ping, iperf) to verify that secondary NICs are reachable. It can also verify that persistent volume claims (PVC) creation is functional for a given storage class.
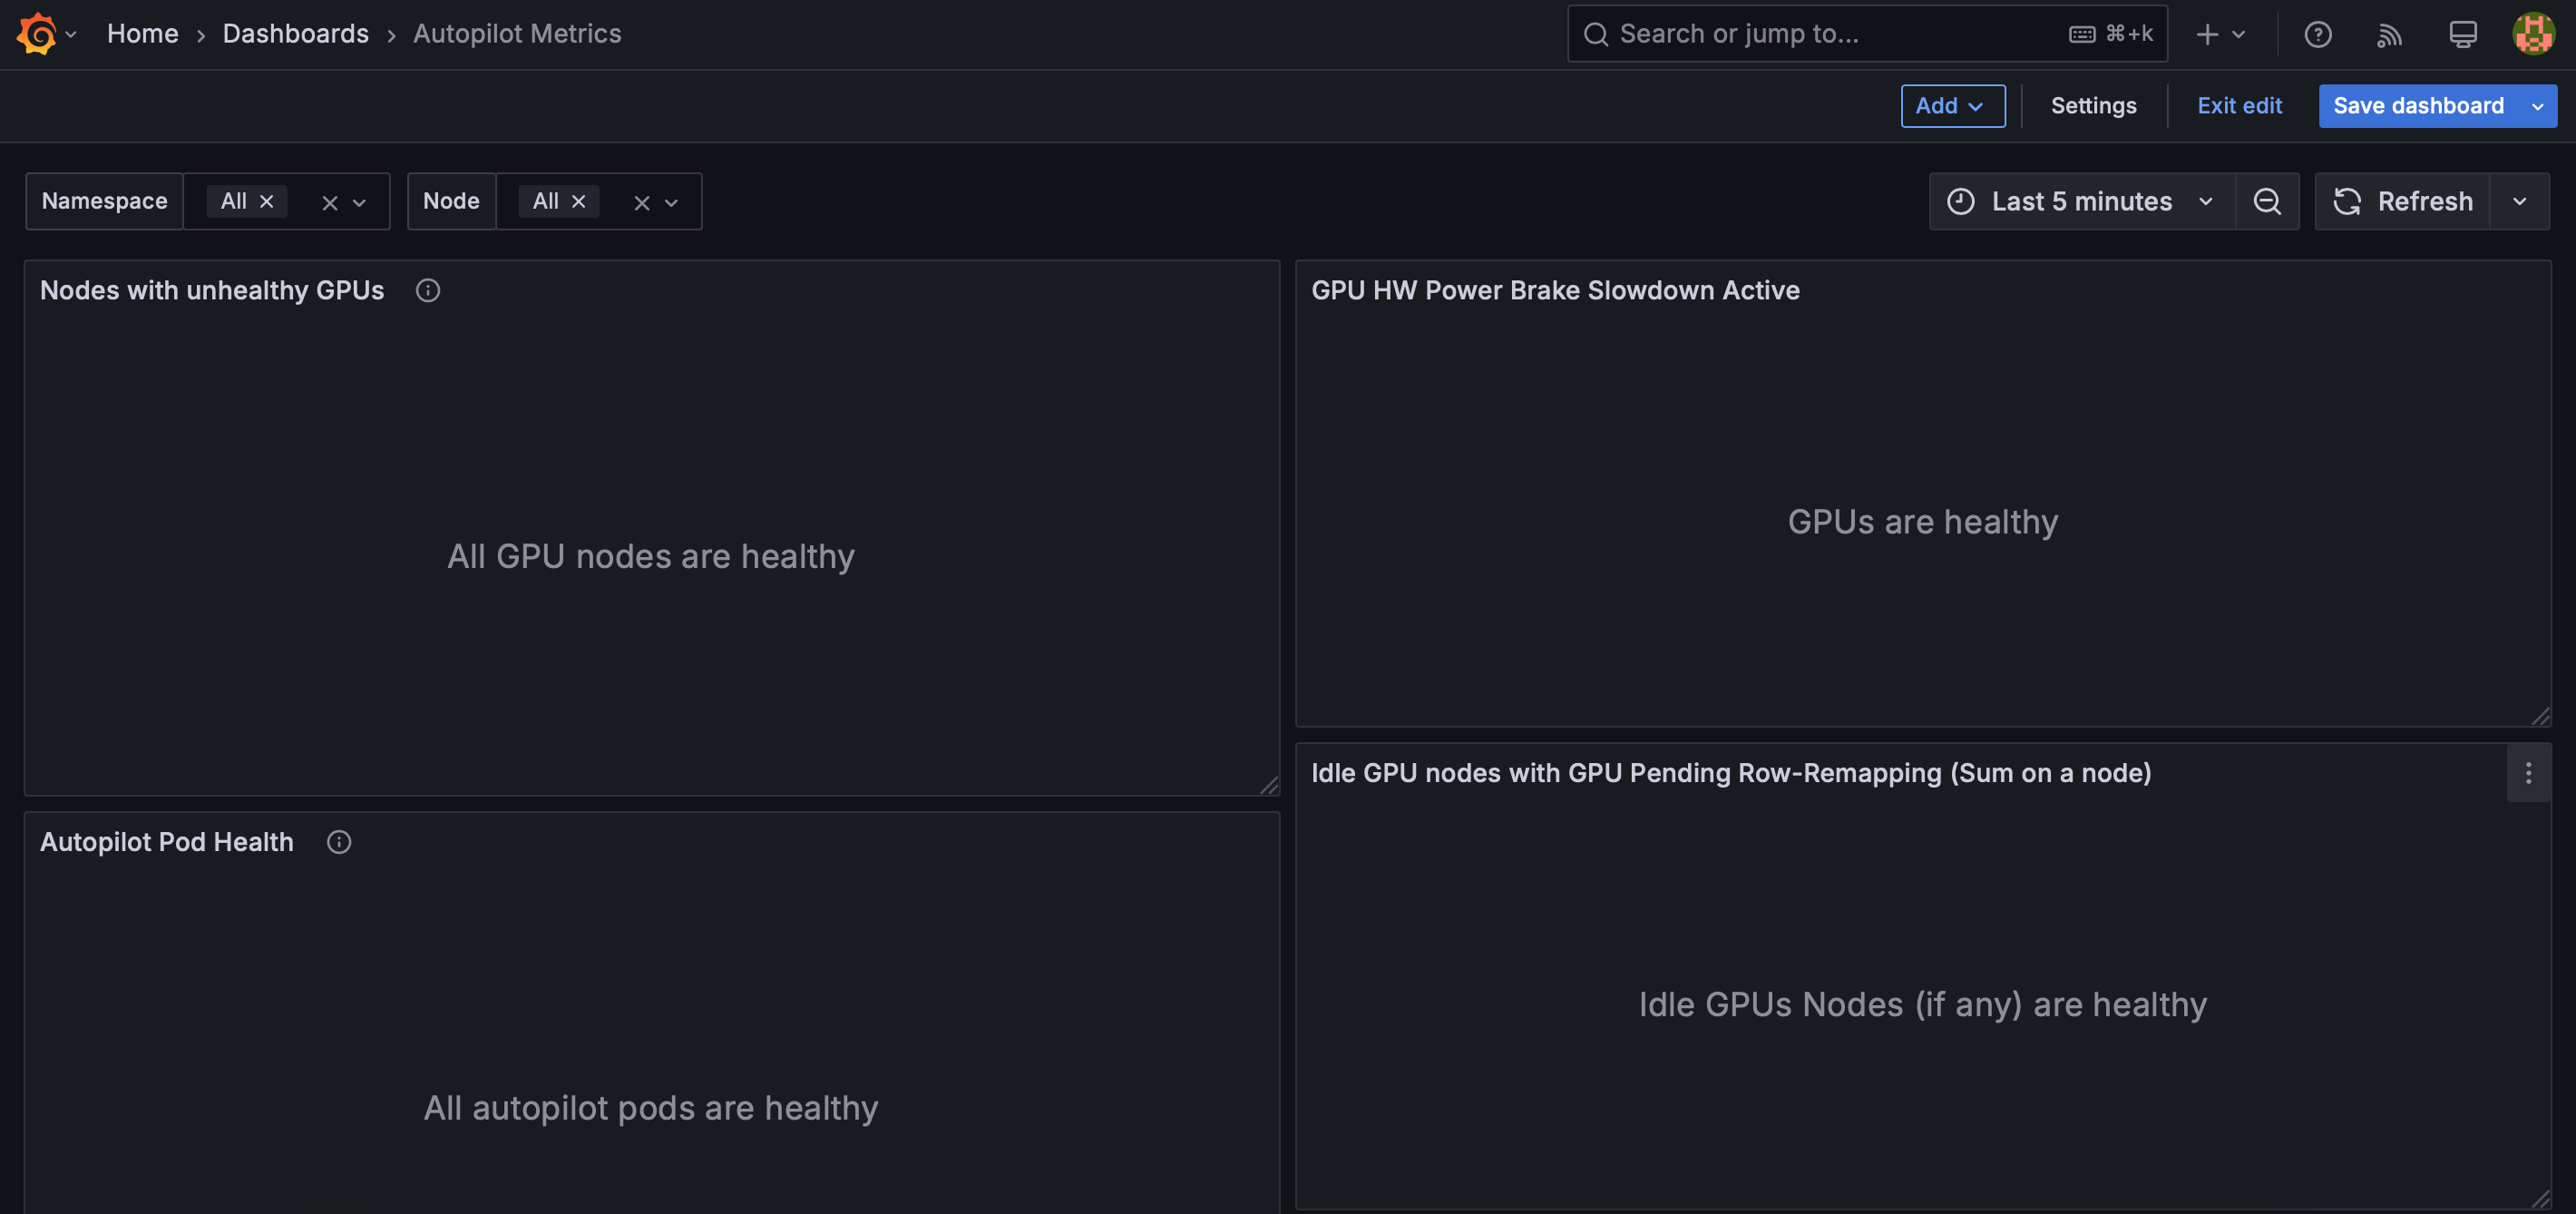
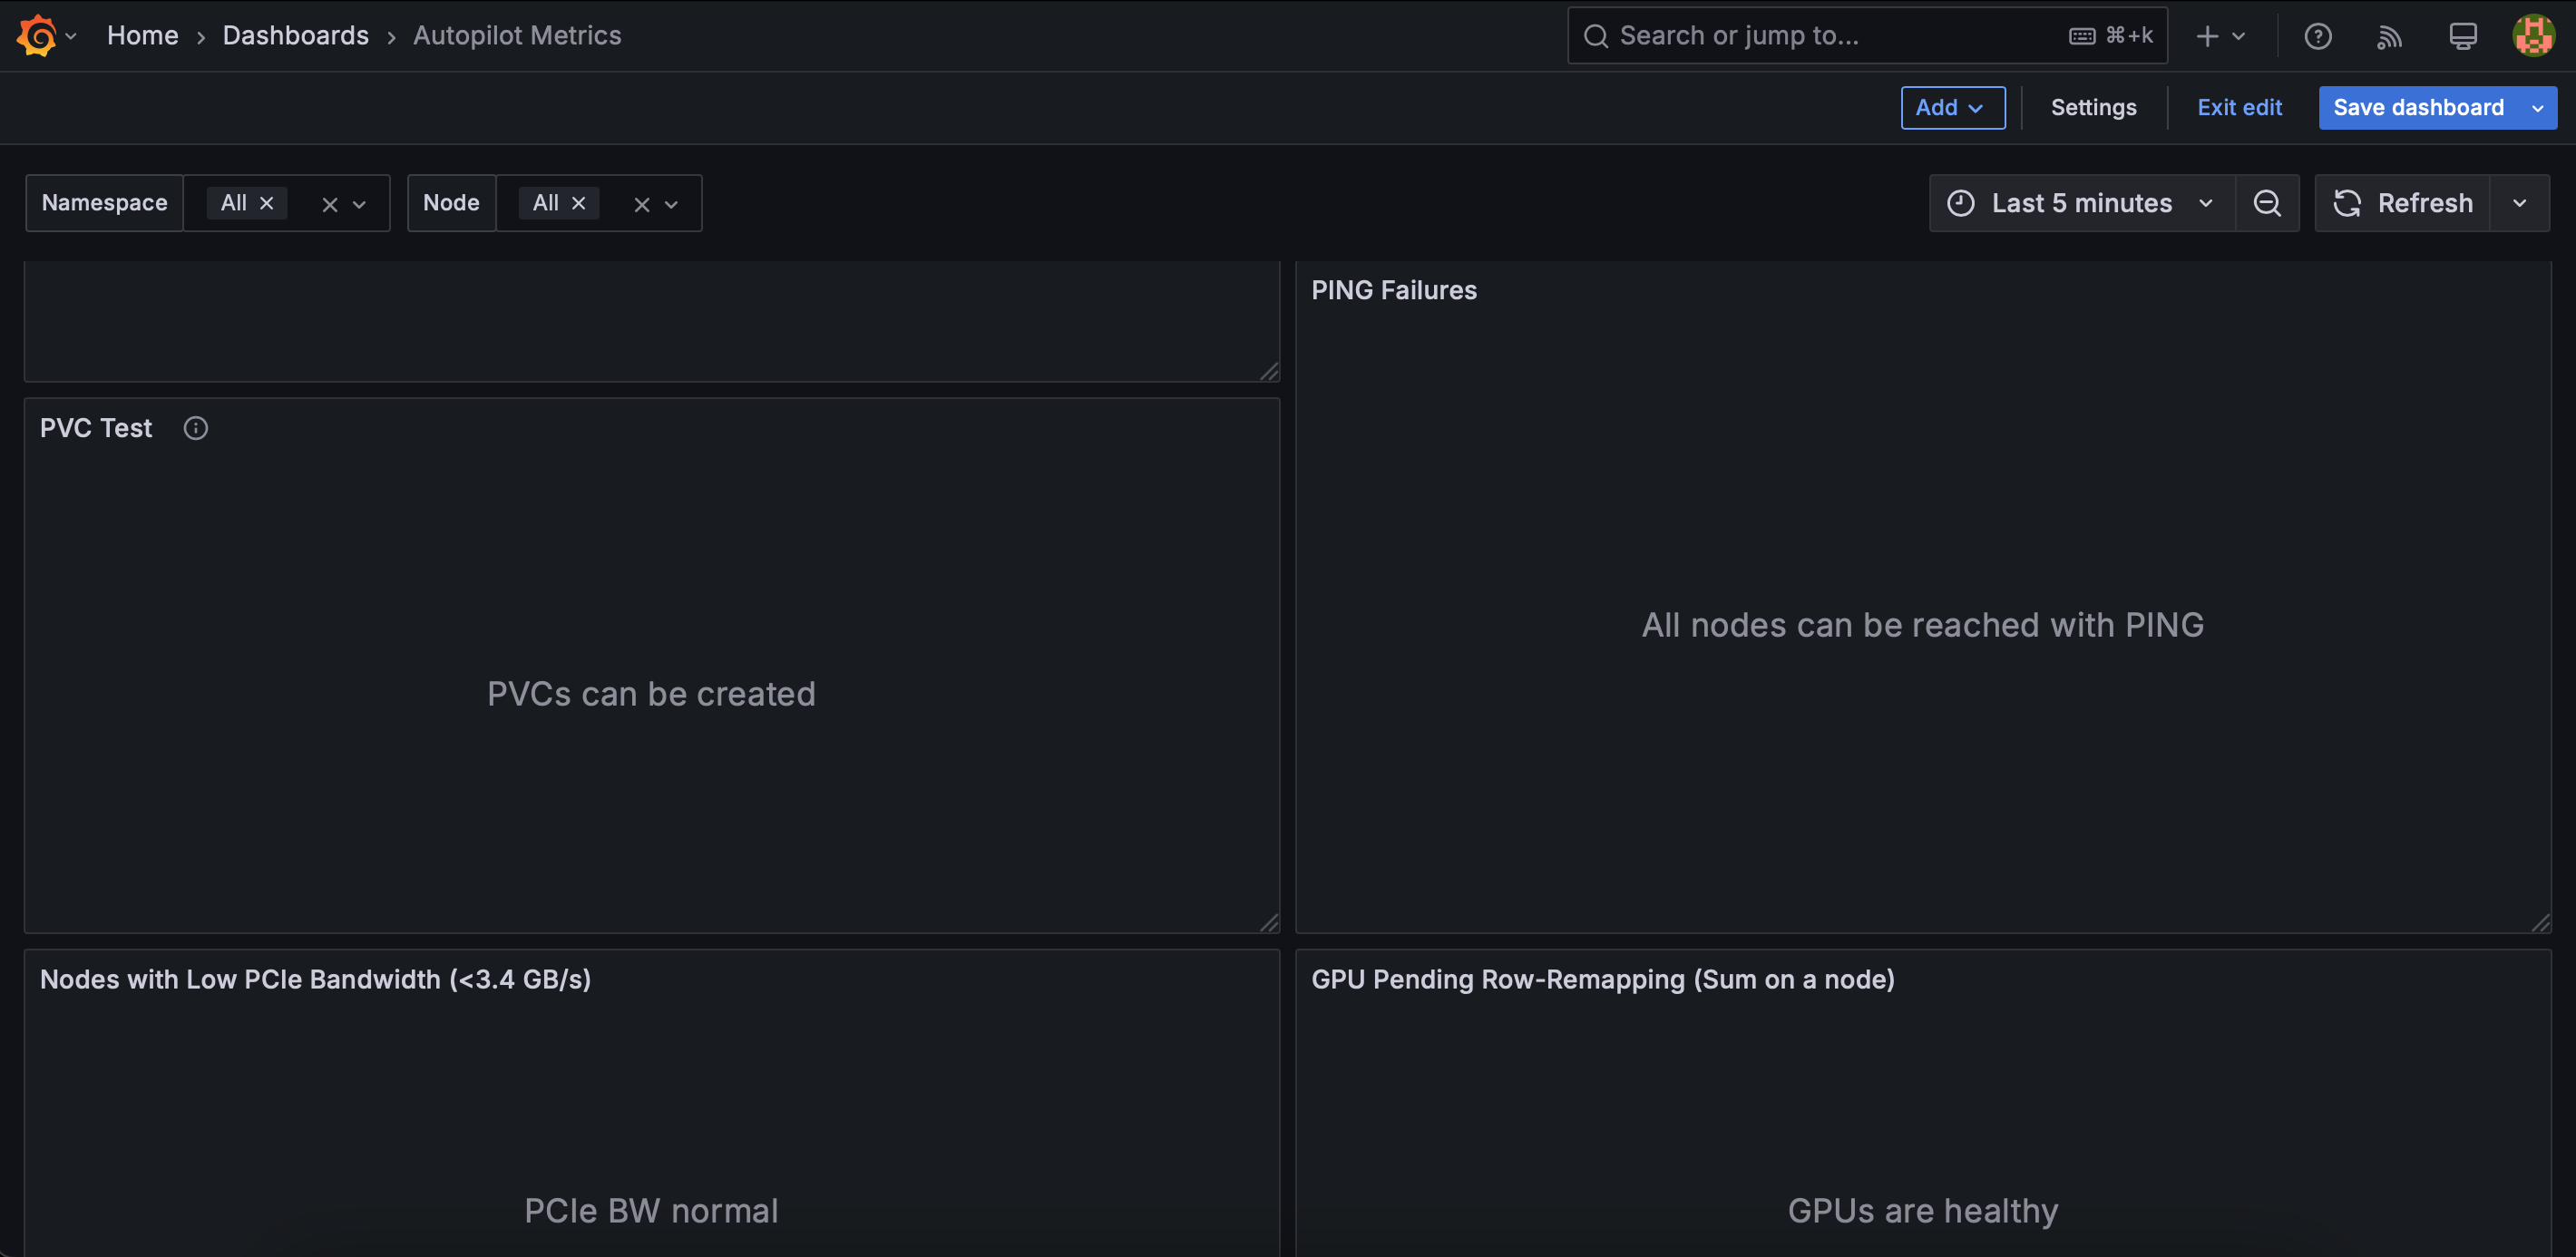
The health checks generating metrics are:
- GPU PCIe Link Bandwidth: The PCIe NVidia bandwidth test to check host-to-device connection on each node
- GPU Memory: GPUs remapped rows evaluation through nvidia-smi
- GPU Memory Bandwidth Performance: GPUs memory bandwidth evaluation through DAXPY and DGEMM
- GPU Diagnostics: NVidia DCGM (Data Center GPU Manager) diagnostics through dcgmi diag
- GPU Power Slowdown: verify if power throttle is active through nvidia-smi
- Network Reachability: ping to evaluate hosts reachability
- PVC Create/Delete: given a storageclass, test the ability to successfully provision a Persistent Volume Claim
- DCGM level 3: deep diagnostics through NVidia DCGM tool. This test runs as a separate Job that reserves all the GPUs in the node if they are free
Data source config
Collector config:
Upload an updated version of an exported dashboard.json file from Grafana
| Revision | Description | Created | |
|---|---|---|---|
| Download |