Dashboard zabbix Linux Server
This dashboard shows the live status of the server. It displays information such as disk usage percentage, memory and CPU usage, number of active processes, and server uptime. It also shows data transfer rates and available swap space.
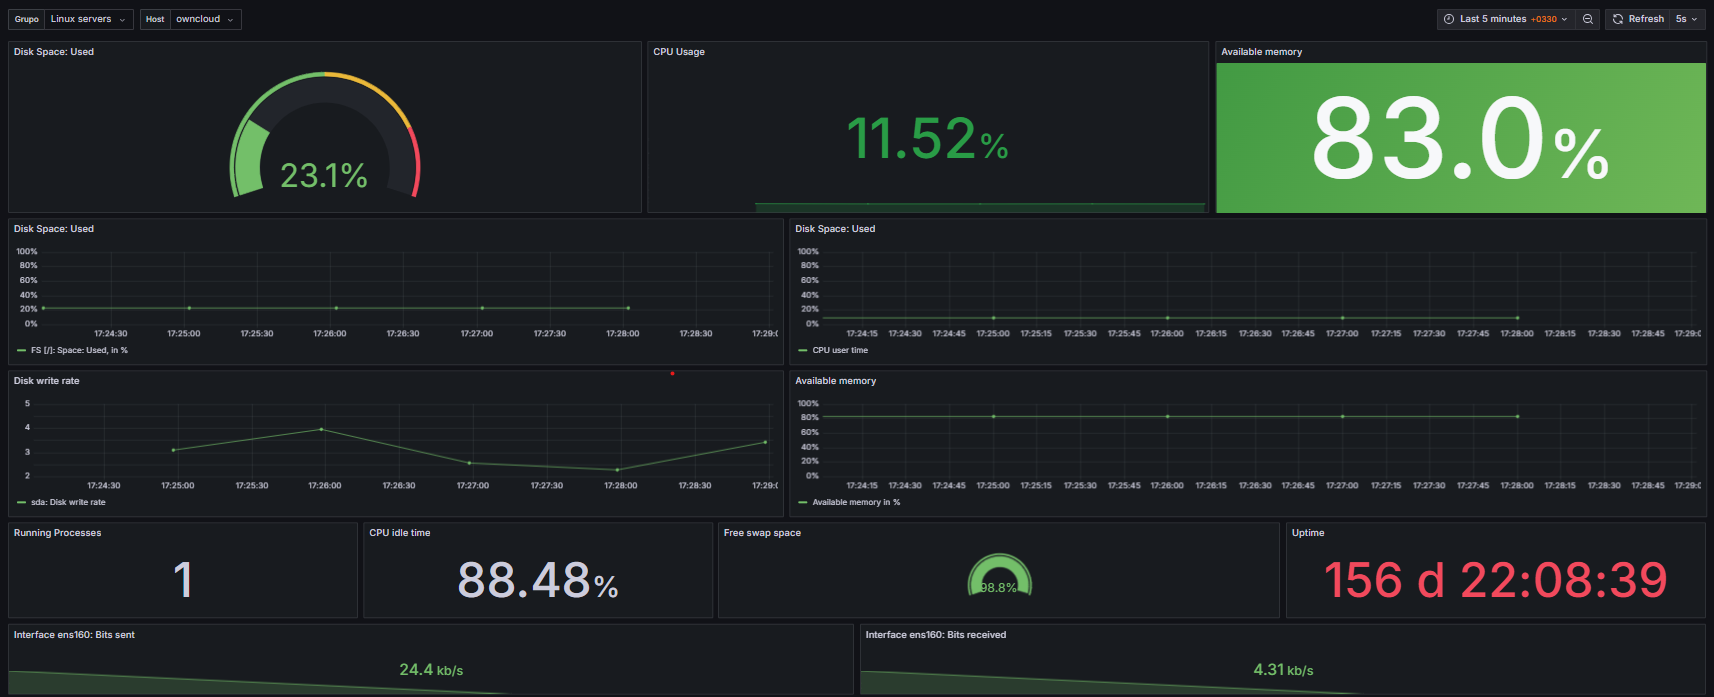
The Dashboard zabbix Linux Server dashboard uses the alexanderzobnin-zabbix-datasource data source to create a Grafana dashboard with the gauge, stat and timeseries panels.
Data source config
Collector type:
Collector plugins:
Collector config:
Revisions
Upload an updated version of an exported dashboard.json file from Grafana
| Revision | Description | Created | |
|---|---|---|---|
| Download |
Linux Server
Monitor Linux with Grafana. Easily monitor your Linux deployment with Grafana Cloud's out-of-the-box monitoring solution.
Learn more