GCP Managed Kafka
GCP Managed Kafka ( Google Cloud Monitoring )
Managed Kafka Grafana Dashboard
Overview
This Grafana dashboard is designed to monitor and visualize key metrics of a Managed Kafka cluster running on Google Cloud Platform (GCP) using Google Cloud Monitoring (Stackdriver).
Features
- Broker Health Monitoring: Tracks memory usage, CPU utilization, and request count for Kafka brokers.
- Cluster Performance Metrics: Displays partition statuses, offline partitions, and long-term storage usage.
- Traffic & Throughput Insights: Provides per-topic byte in/out and request count metrics.
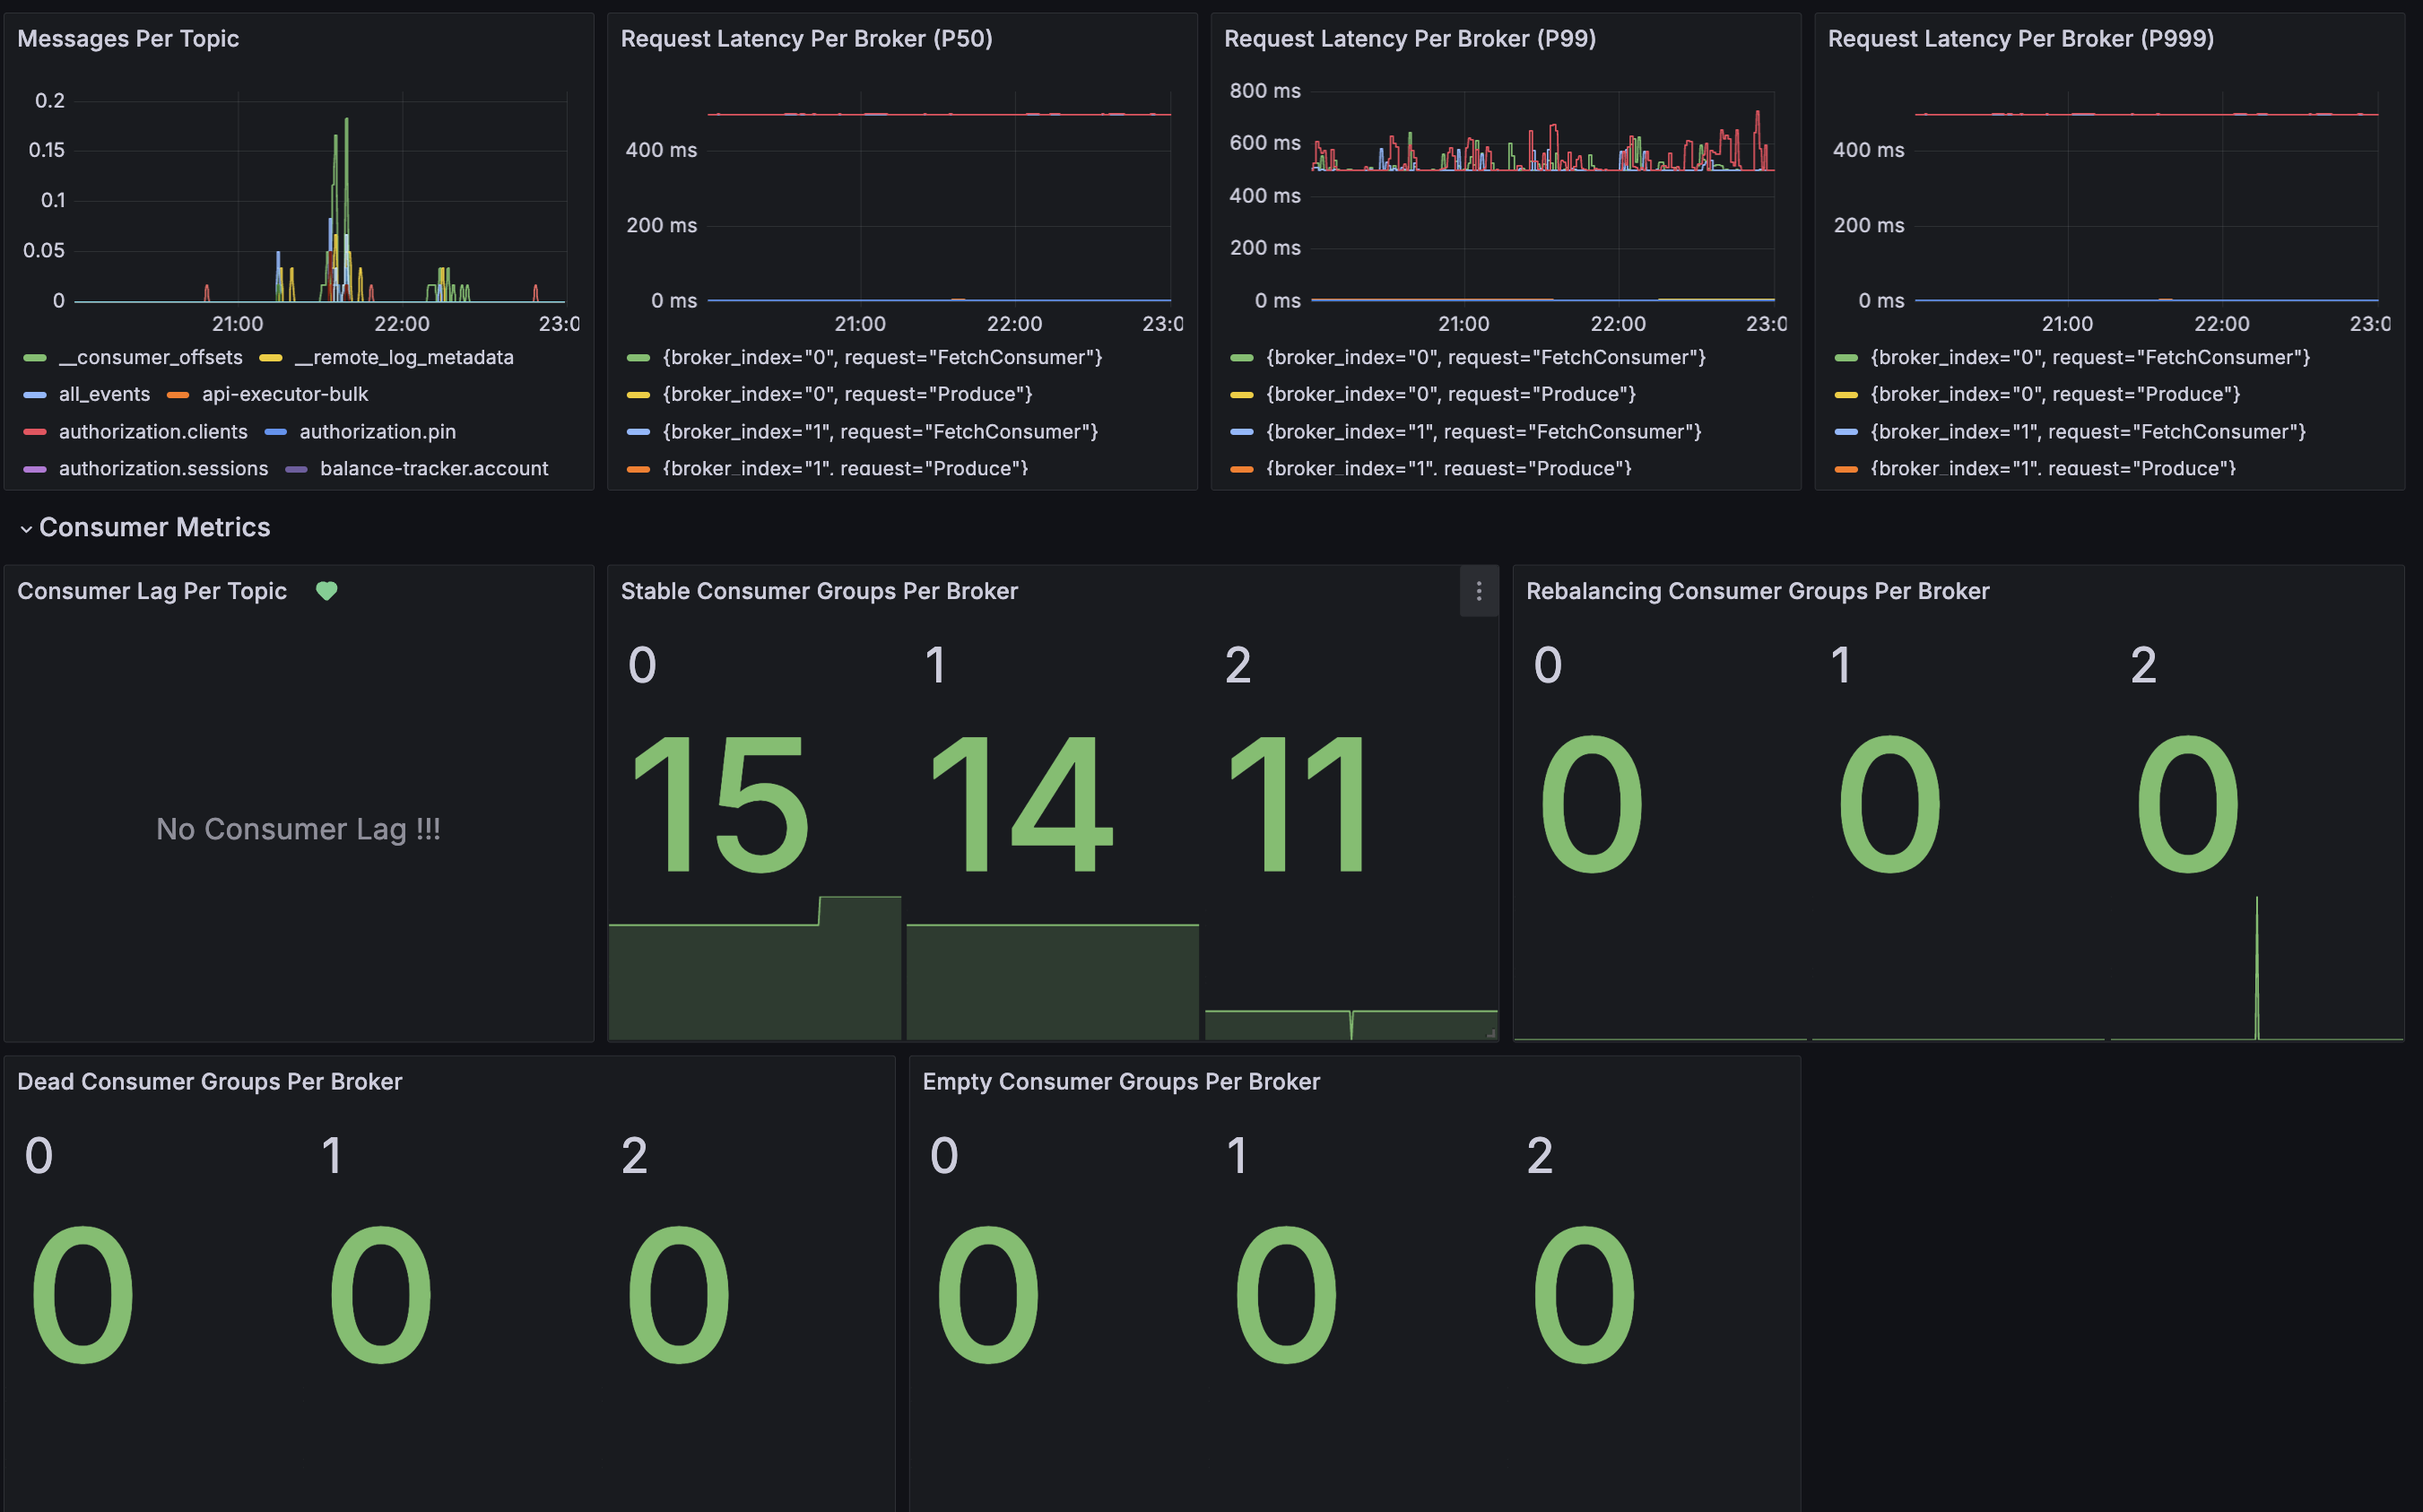
- Latency Monitoring: Tracks Kafka request latencies (P50, P99, P999).
- Consumer Metrics: Monitors consumer lag, stable/rebalancing consumer groups, and dead/empty consumer groups.
- Custom Alerts & Annotations: Built-in support for monitoring annotations and alerts.
- Kafka UI Quick Access: Direct link to the Kafka UI for deeper analysis.
Data Source
The dashboard uses Google Cloud Monitoring (Stackdriver) as the primary data source, configured via:
- Datasource:
${DS_GCP} - Project:
$cluster
Panels
The dashboard includes the following panels:
- Memory Usage (Stat Panel)
- CPU Usage (Stat Panel)
- Request Count Usage (Gauge Panel)
- Offline Partitions (Stat Panel)
- Total Partitions Per Broker (Stat Panel)
- Long-Term Storage Usage (Stat Panel)
- Byte In/Out Per Topic (Stat Panels)
- Topic Request Count & Error Count (Stat Panels)
- Messages Per Topic (Time Series Panel)
- Request Latency Per Broker (P50, P99, P999) (Time Series Panels)
- Consumer Lag Per Topic (Time Series Panel)
- Stable, Rebalancing, Dead, and Empty Consumer Groups (Stat Panels)
Refresh & Time Settings
- Refresh Rate: Every 30 seconds
- Time Range: Last 1 hour
Usage Instructions
- Ensure Data Source is Configured: Update the
${DS_GCP}variable to match your GCP project. - Modify Thresholds if Needed: Adjust alert thresholds for memory, CPU, and consumer lag based on your operational requirements.
- Use Kafka UI for Deep Dive: Click on the Kafka UI link to access additional insights.
- Set Up Alerts: Utilize Grafana alerting rules to notify on critical metrics.
Tags
Cloud MonitoringKafkaGCP
Dashboard UID
aeff2g49qgc8wa
Notes
- Make sure the correct GCP project permissions are granted to access Kafka metrics.
- Use Grafana Variables (
$cluster) for multi-cluster monitoring support. - For further customization, modify the PromQL queries in the panel configurations.
Created with Grafana v11.2.0
Data source config
Collector type:
Collector plugins:
Collector config:
Revisions
Upload an updated version of an exported dashboard.json file from Grafana
| Revision | Description | Created | |
|---|---|---|---|
| Download |
Kafka
Easily monitor your Kafka deployment with Grafana Cloud's out-of-the-box monitoring solution.
Learn more