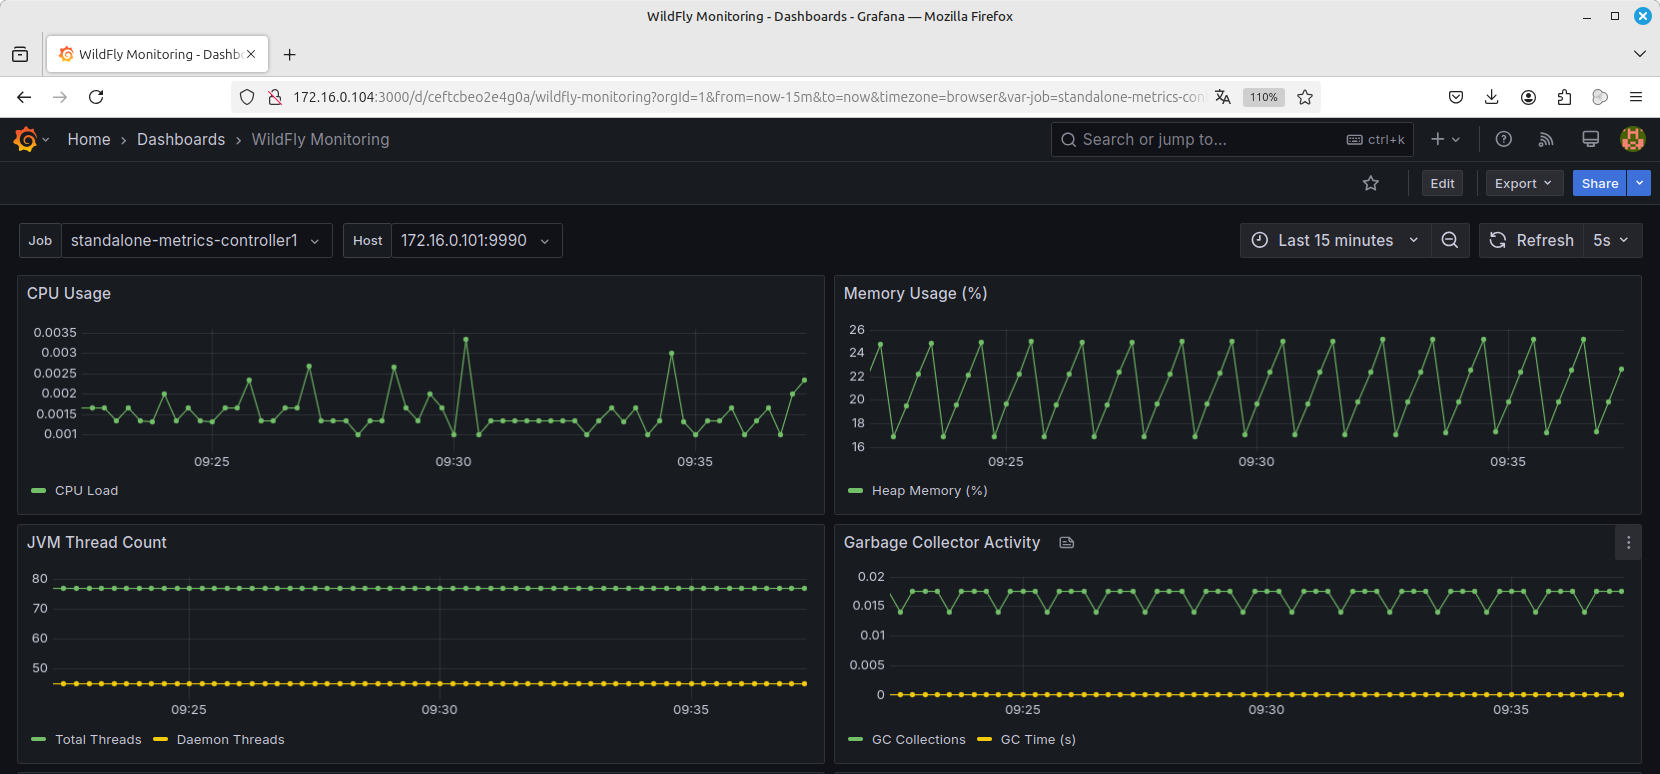
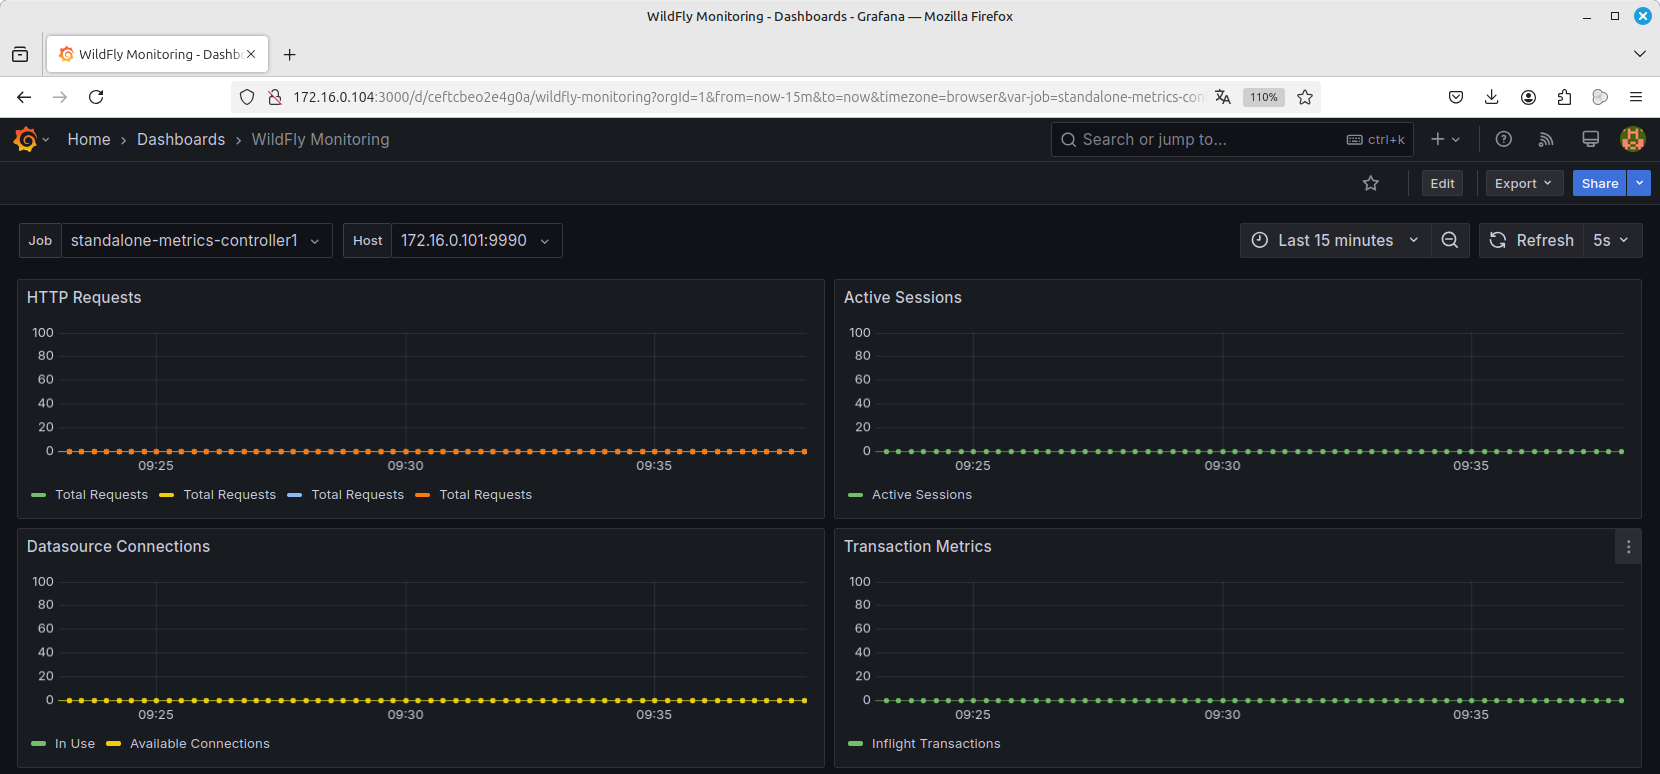
WildFly Monitoring
Dashboard completo para monitoramento do WildFly via Prometheus
Configure Prometheus to collect metrics from WildFly servers running in Standalone mode by adding the following configuration to your Prometheus configuration file (prometheus.yml):
job_name: 'wildfly-standalone-controller1' metrics_path: '/metrics' static_configs:
- targets: ['172.16.0.101:9990'] fallback_scrape_protocol: 'PrometheusText0.0.4'
job_name: 'wildfly-standalone-controller2' metrics_path: '/metrics' static_configs:
- targets: ['172.16.0.102:9990'] fallback_scrape_protocol: 'PrometheusText0.0.4'
After applying this configuration, Prometheus will collect metrics from Wildfly application servers running in standalone mode, enabling effective monitoring and visualization in Grafana.
Data source config
Collector config:
Upload an updated version of an exported dashboard.json file from Grafana
| Revision | Description | Created | |
|---|---|---|---|
| Download |
Wildfly
Easily monitor Wildfly, a modular and lightweight application server, with Grafana Cloud's out-of-the-box monitoring solution.
Learn more