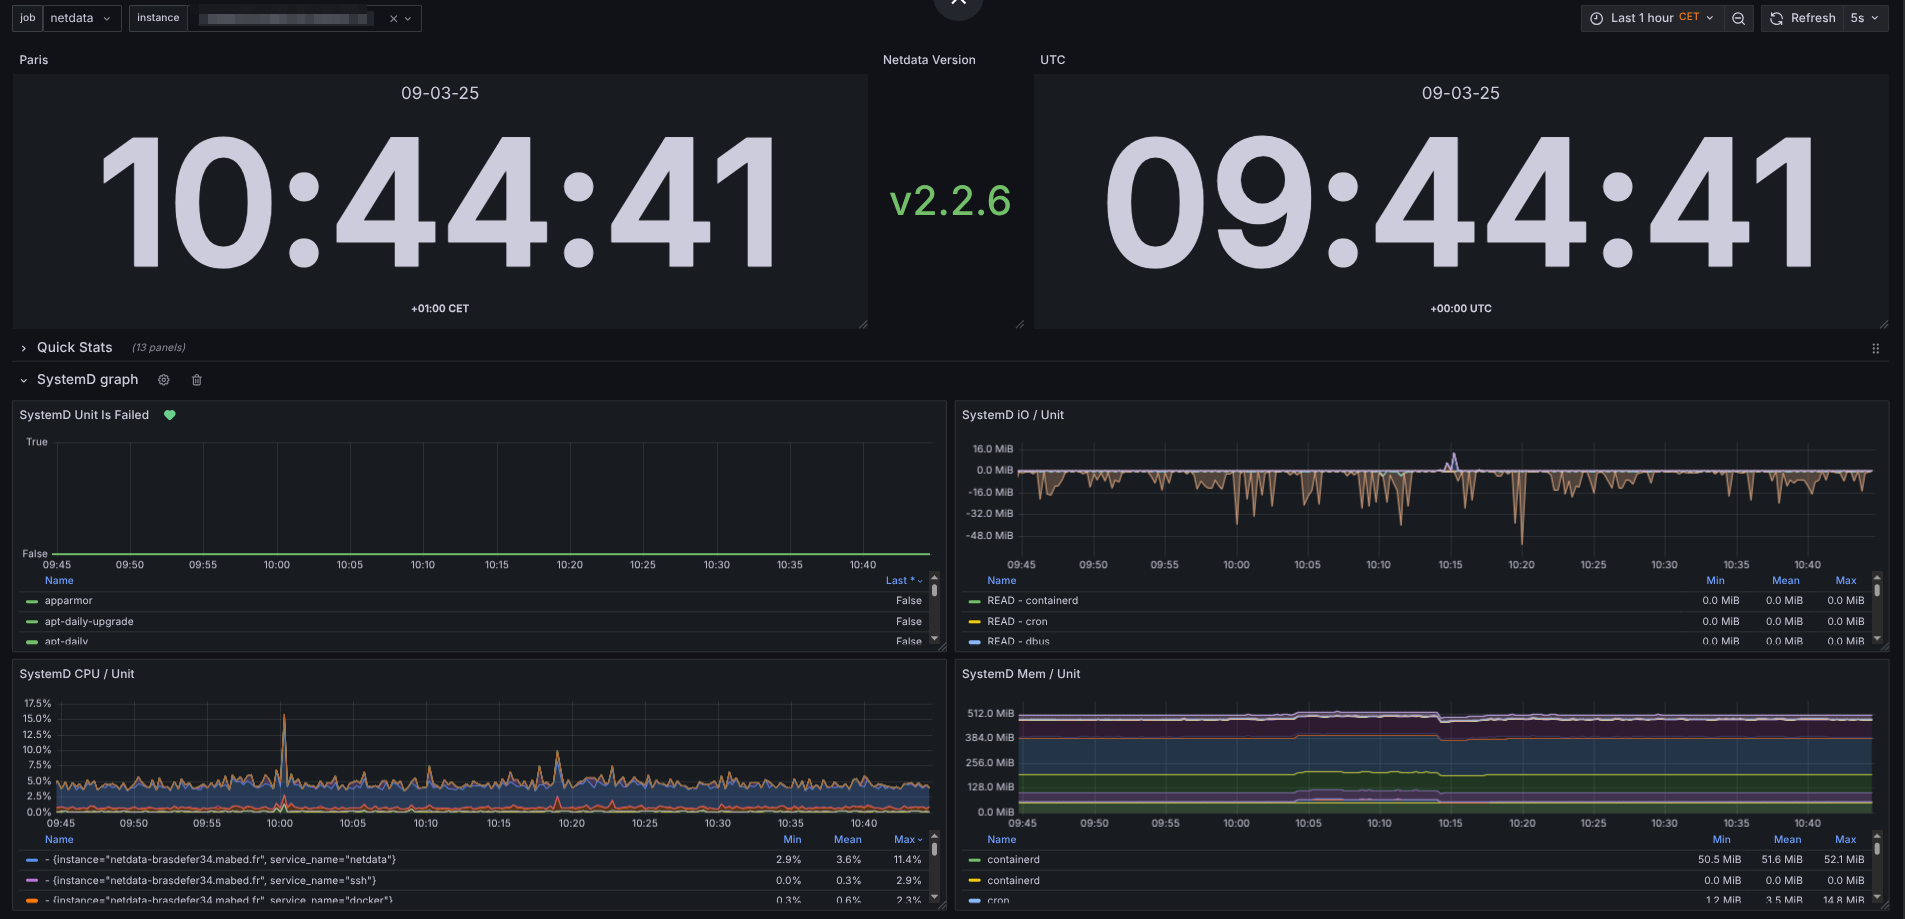
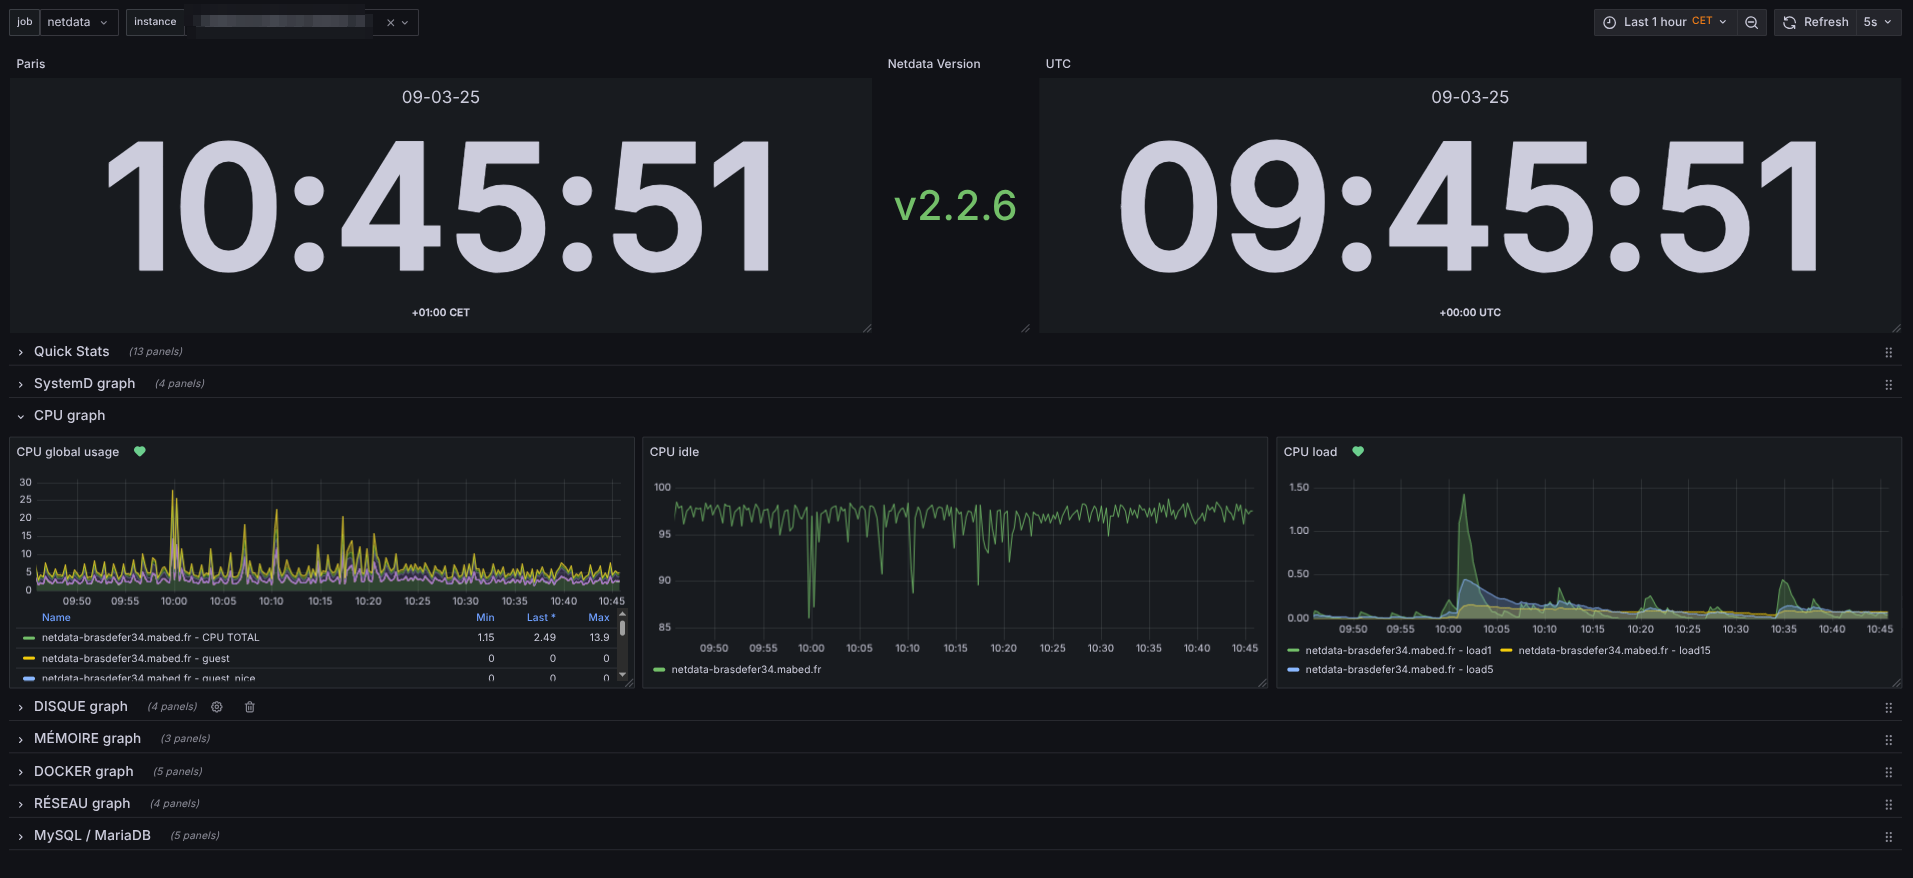
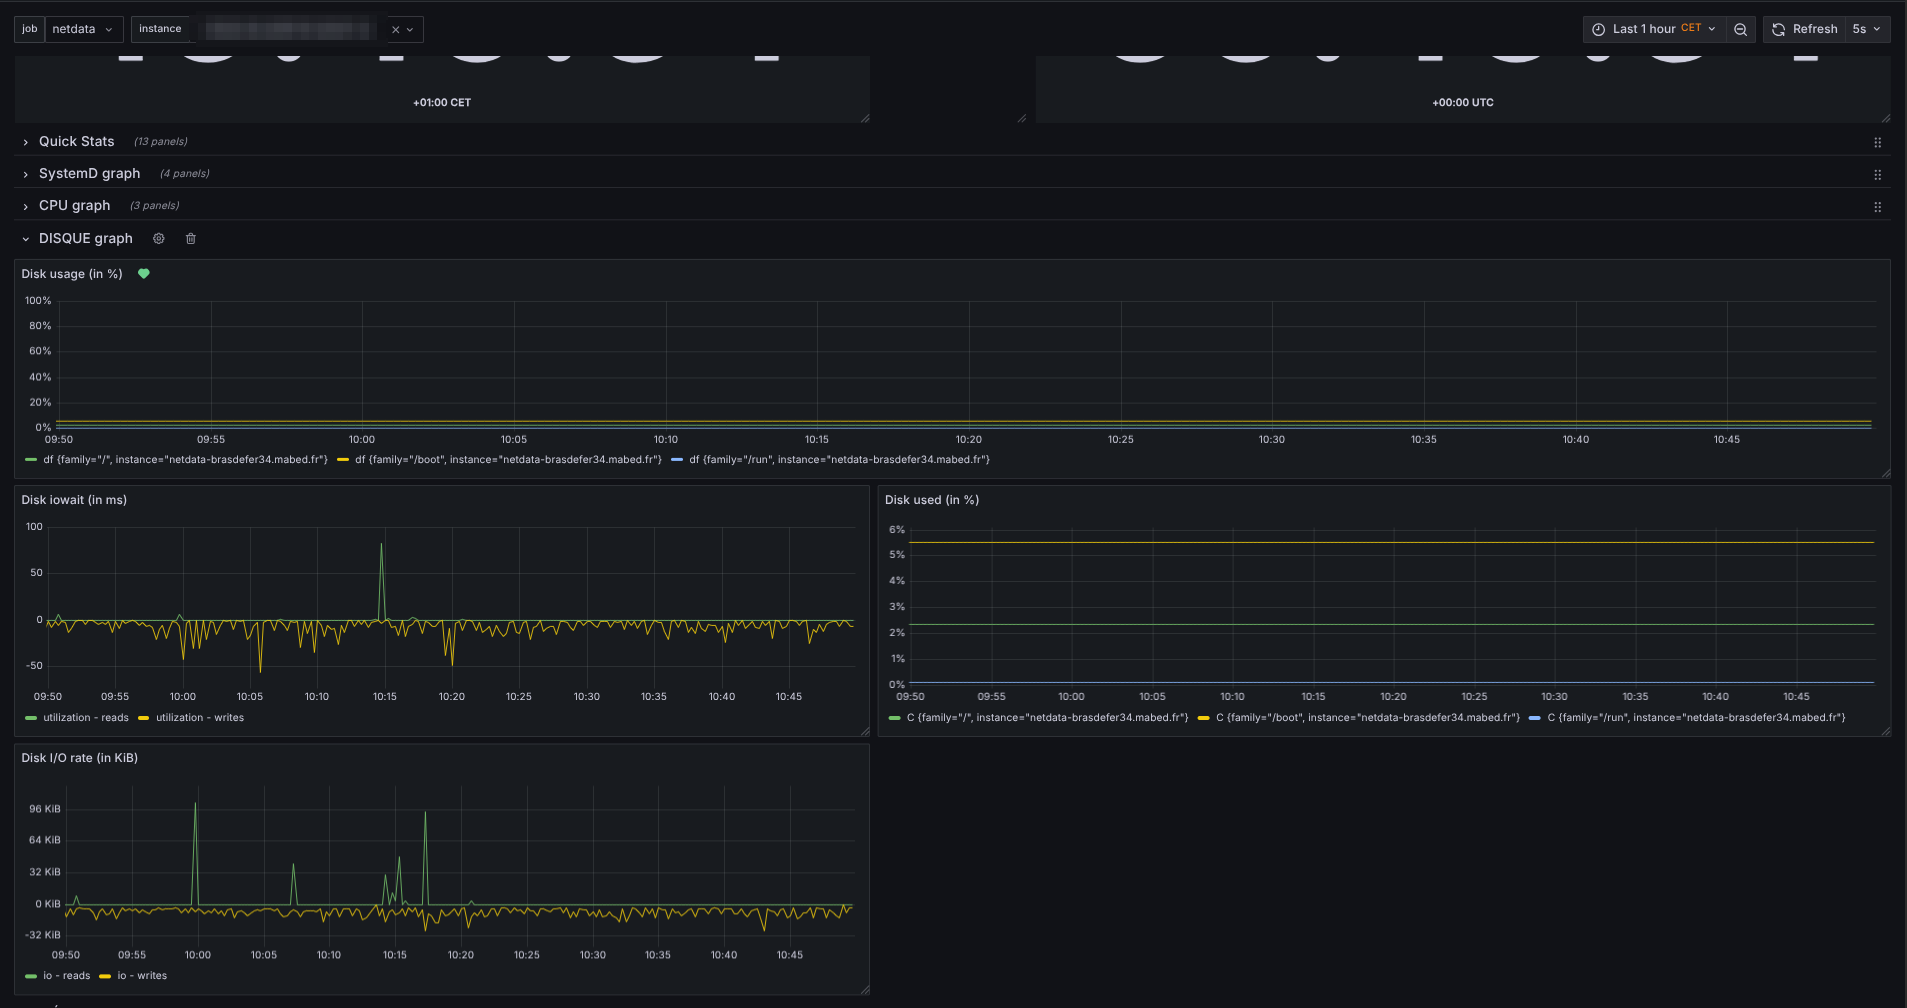
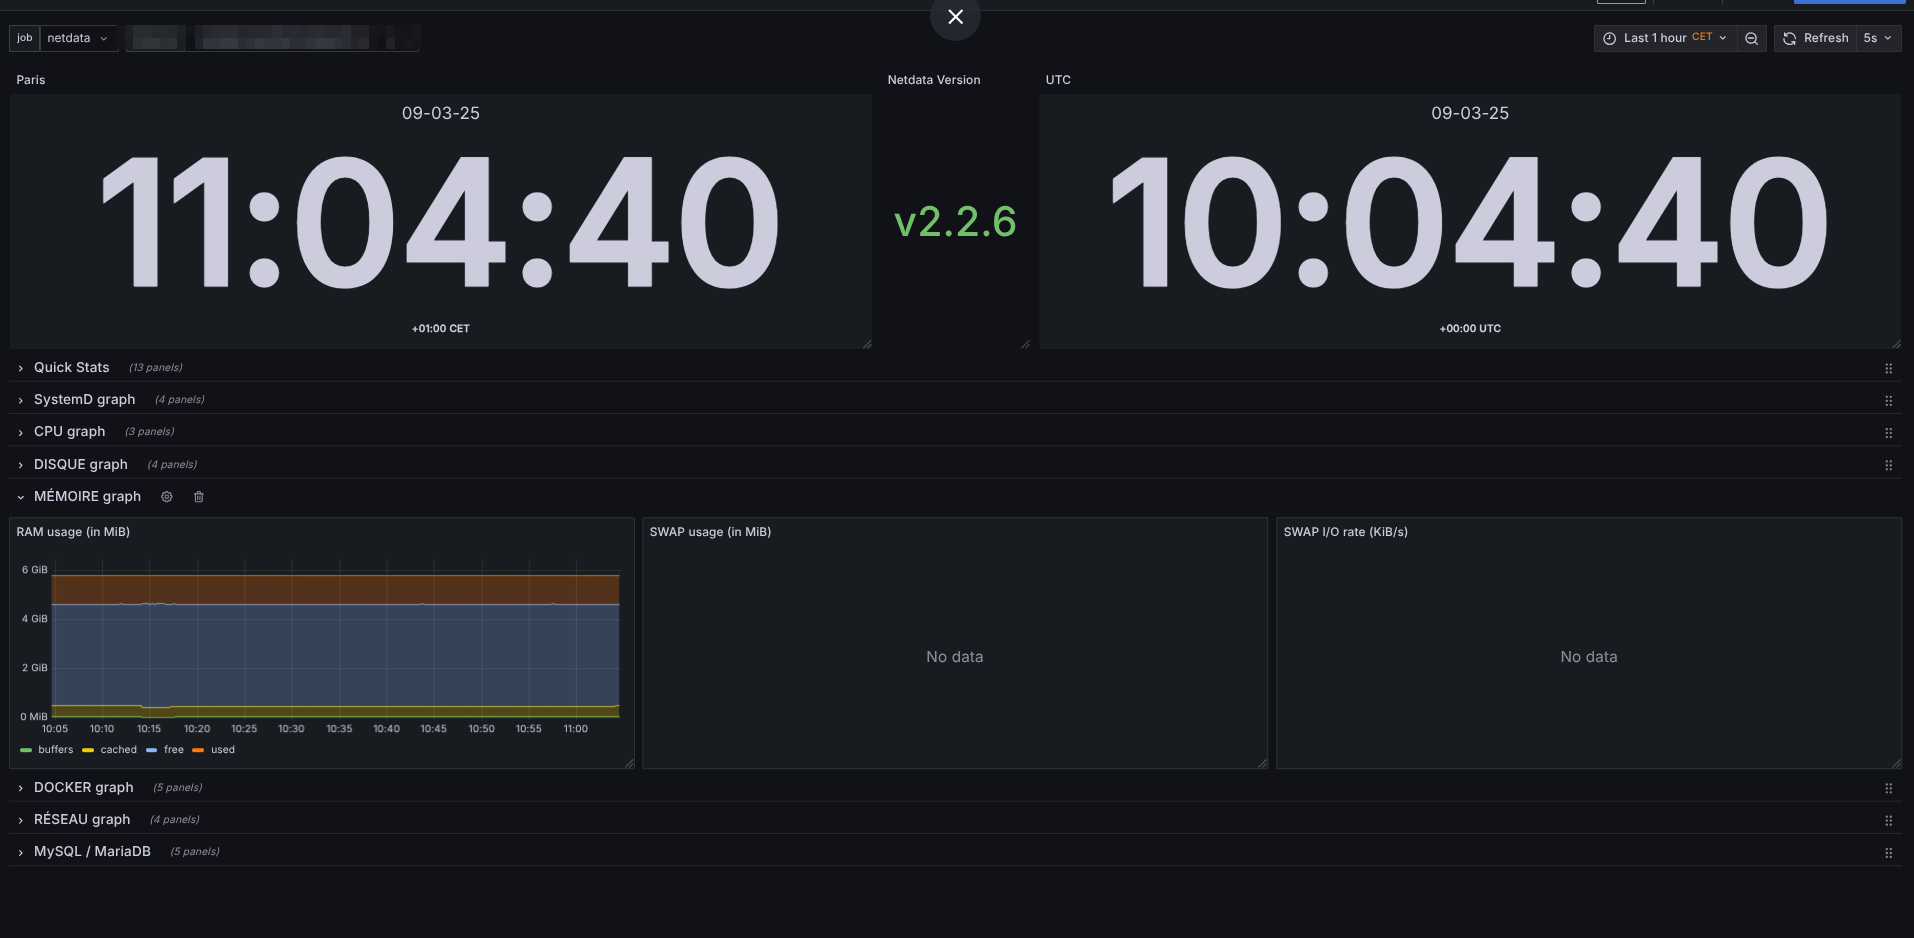
LINUX-MACHINE
Netdata up to 2.2.6 Prometheus 3.2.1 Grafana 11.5.2 My prom configuration - job_name: 'netdata' scrape_interval: 5s metrics_path: '/api/v1/allmetrics?format=prometheus&variables=yes' scheme: http static_configs: - targets: - 'netdata-xxxxx.exemple.fr' - 'netdata-yyyyy.exemple.fr' - 'netdata-zzzzz.exemple.fr'
Netdata up to 2.2.6 Prometheus 3.2.1 Grafana 11.5.2 My prom configuration
- job_name: 'netdata'
scrape_interval: 5s
metrics_path: '/api/v1/allmetrics?format=prometheus&variables=yes'
scheme: http
static_configs:
- targets:
- 'netdata-xxxxx.exemple.fr'
- 'netdata-yyyyy.exemple.fr'
- 'netdata-zzzzz.exemple.fr'
- targets:
Data source config
Collector type:
Collector plugins:
Collector config:
Revisions
Upload an updated version of an exported dashboard.json file from Grafana
| Revision | Description | Created | |
|---|---|---|---|
| Download |
Java Virtual Machine (JVM)
Easily monitor a Java virtual machine, which allows computers to run Java programs, with Grafana Cloud's out-of-the-box monitoring solution.
Learn more