Spark-Operator Scale Test Dashboard
Dashboard with metrics from spark-operator and Kubernetes metrics for visibility into the operator's performance.
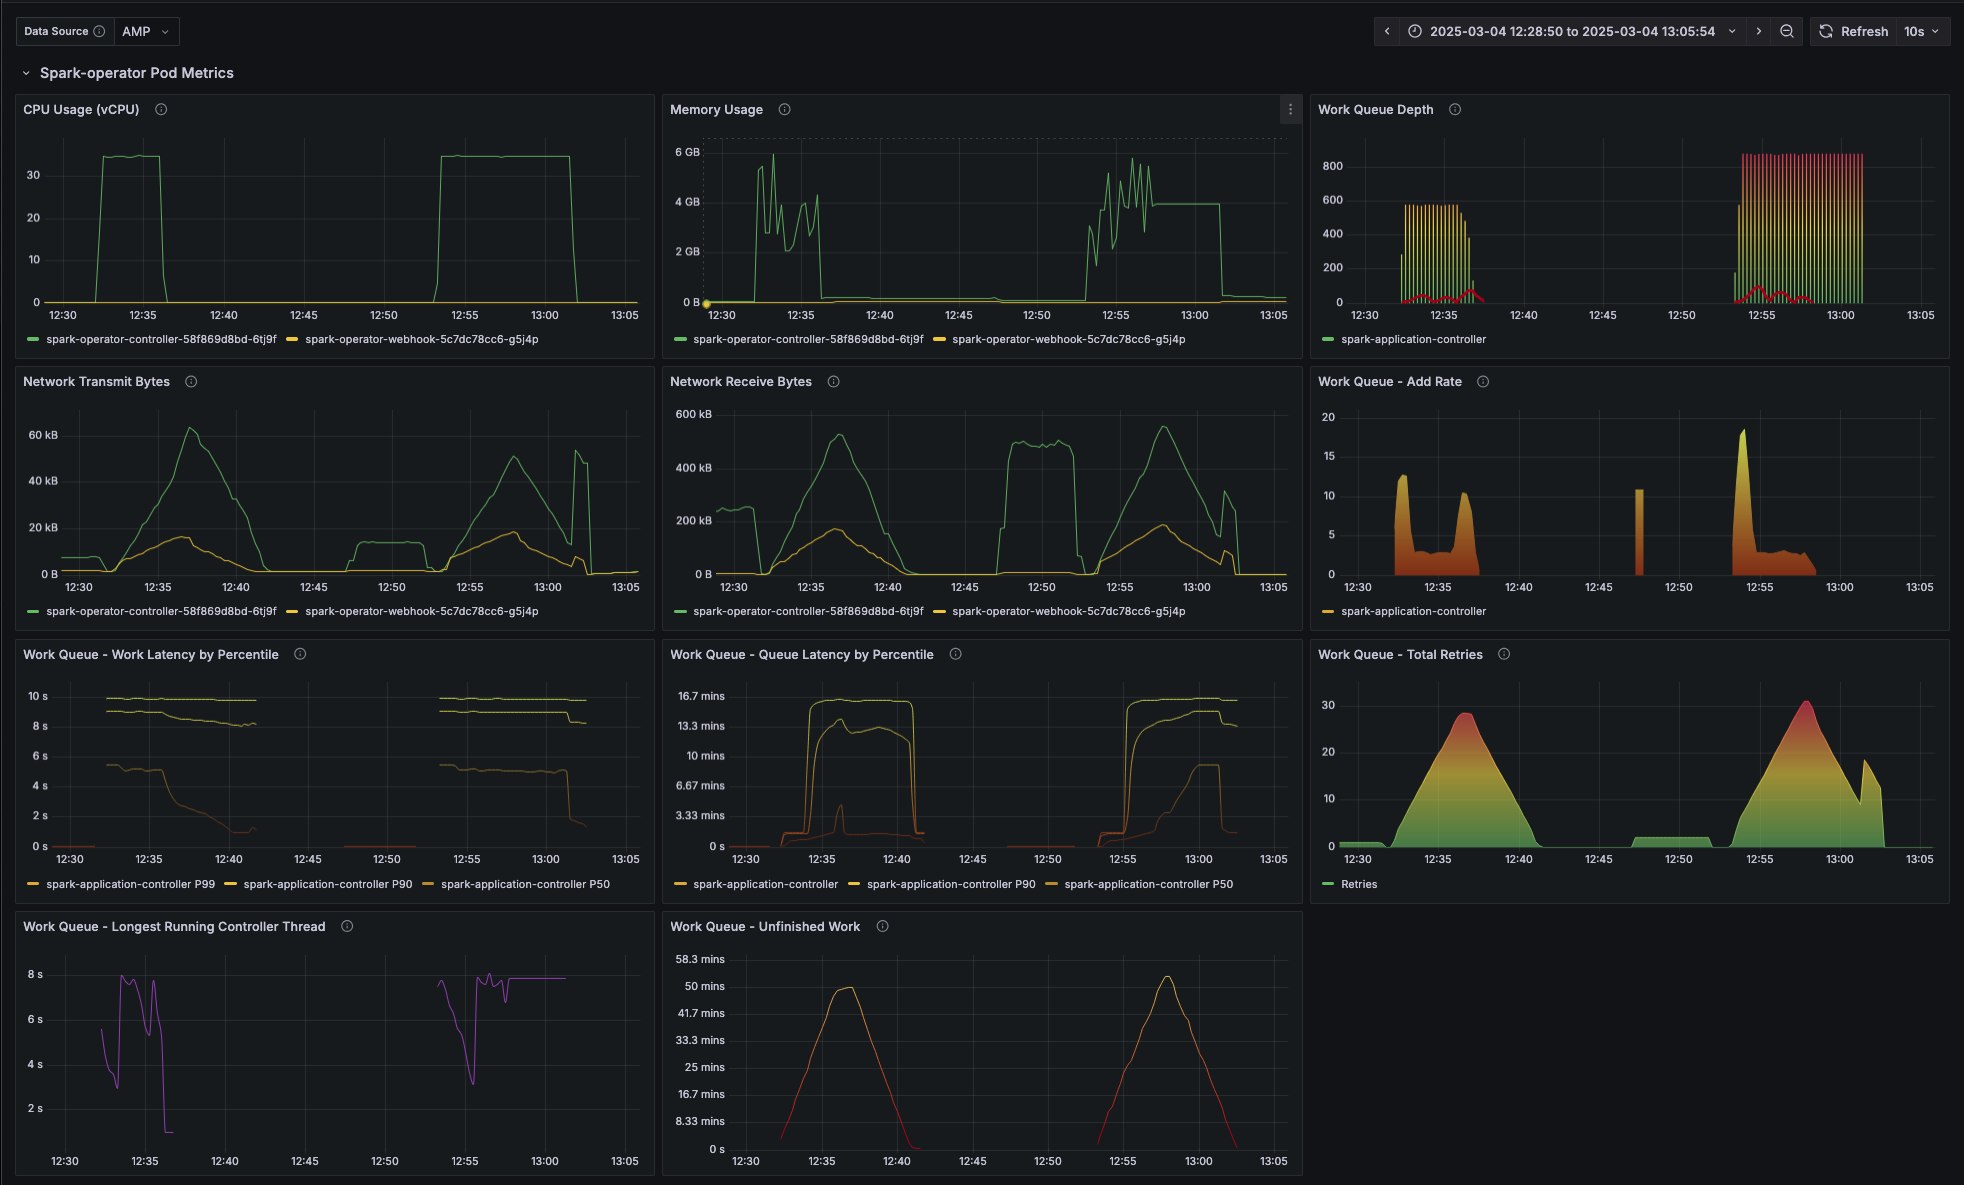
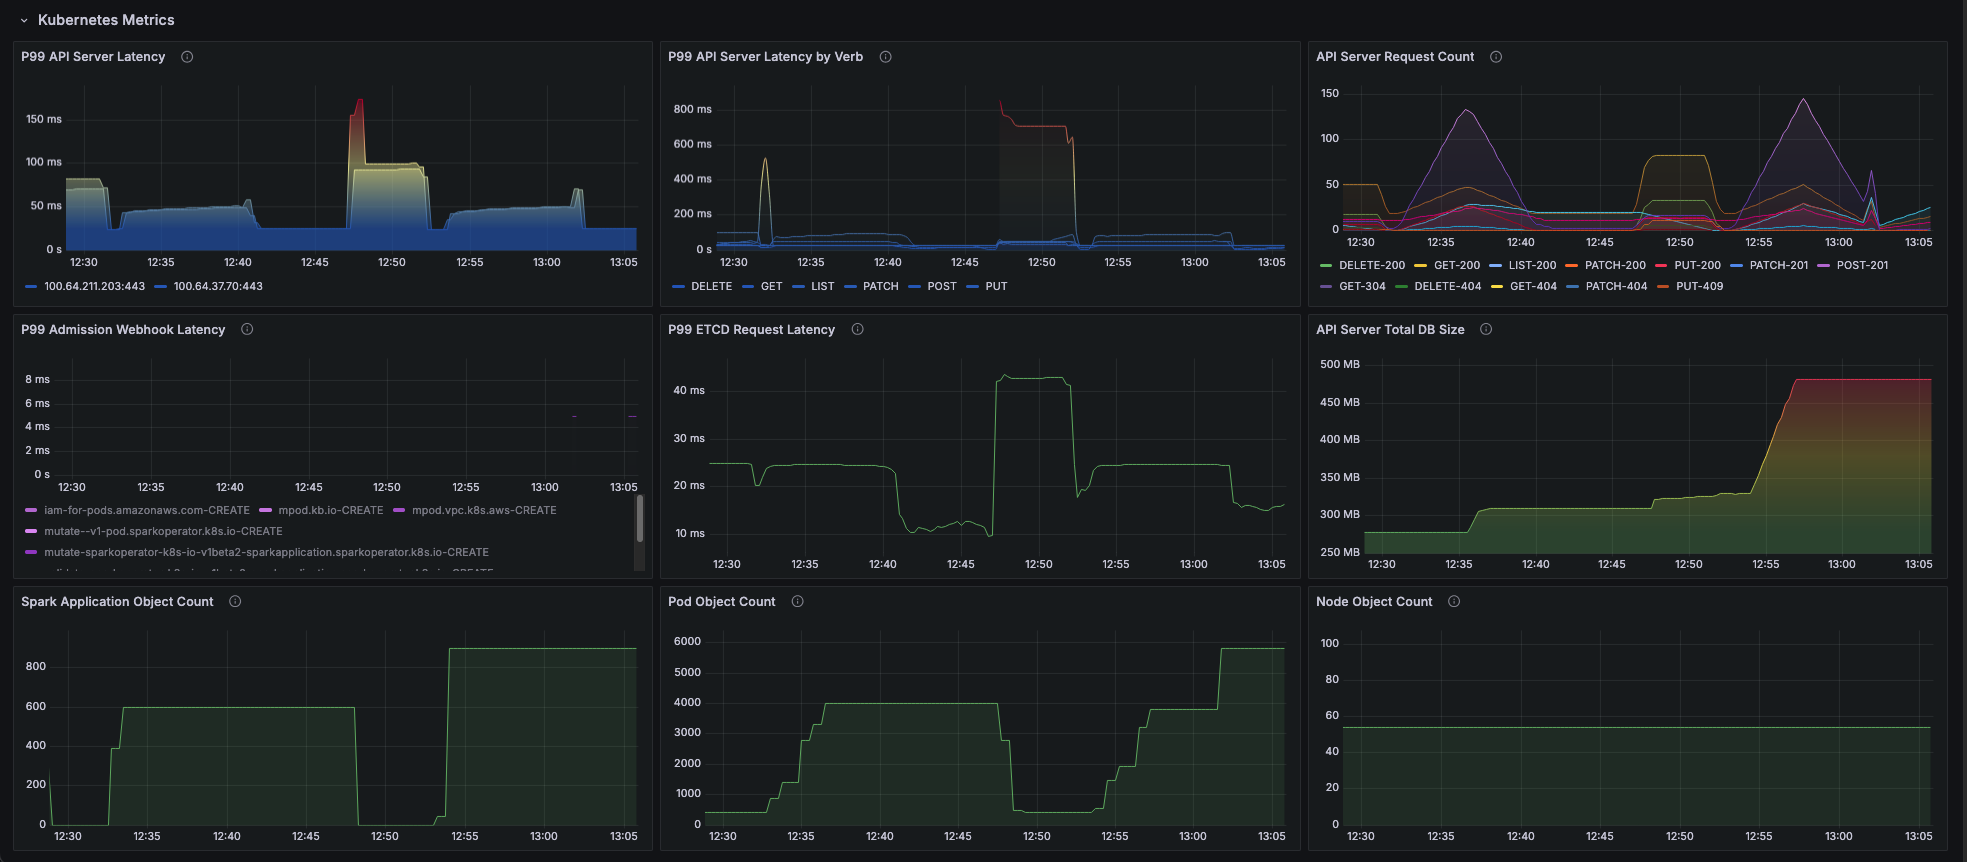
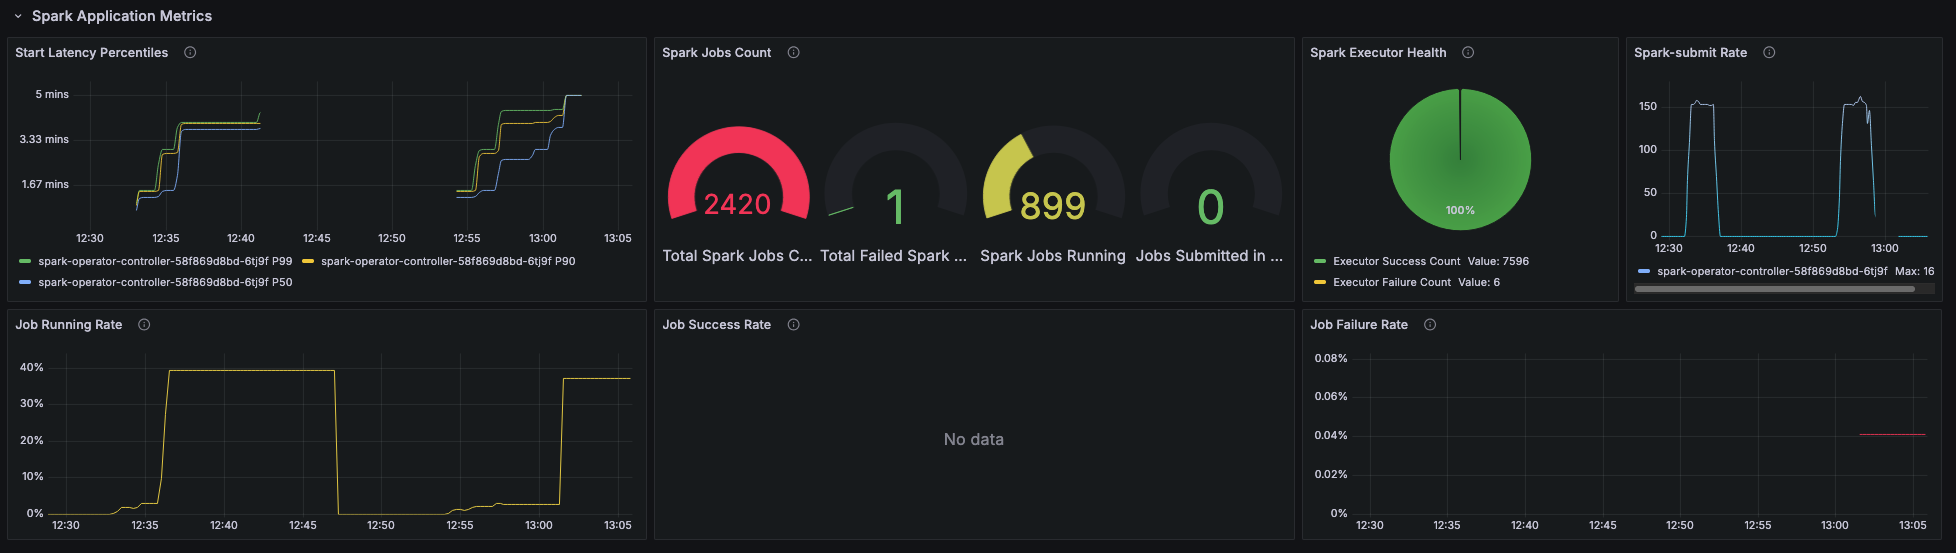
The Spark-Operator Scale Test Dashboard dashboard uses the prometheus data source to create a Grafana dashboard with the gauge, piechart and timeseries panels.
Data source config
Collector type:
Collector plugins:
Collector config:
Revisions
Upload an updated version of an exported dashboard.json file from Grafana
| Revision | Description | Created | |
|---|---|---|---|
| Download |
Apache Spark
Easily monitor Apache Spark, a unified analytics engine for large-scale data processing, with Grafana Cloud's out-of-the-box monitoring solution.
Learn more