OpenSearch
This dashboard is the result of the build of the mixin dashboards published by the OpenSearch Prometheus Exporter plugin by Aiven (https://github.com/Aiven-Open/prometheus-exporter-plugin-for-opensearch/tree/mixin). The dashboard is Grafana 11 compatible
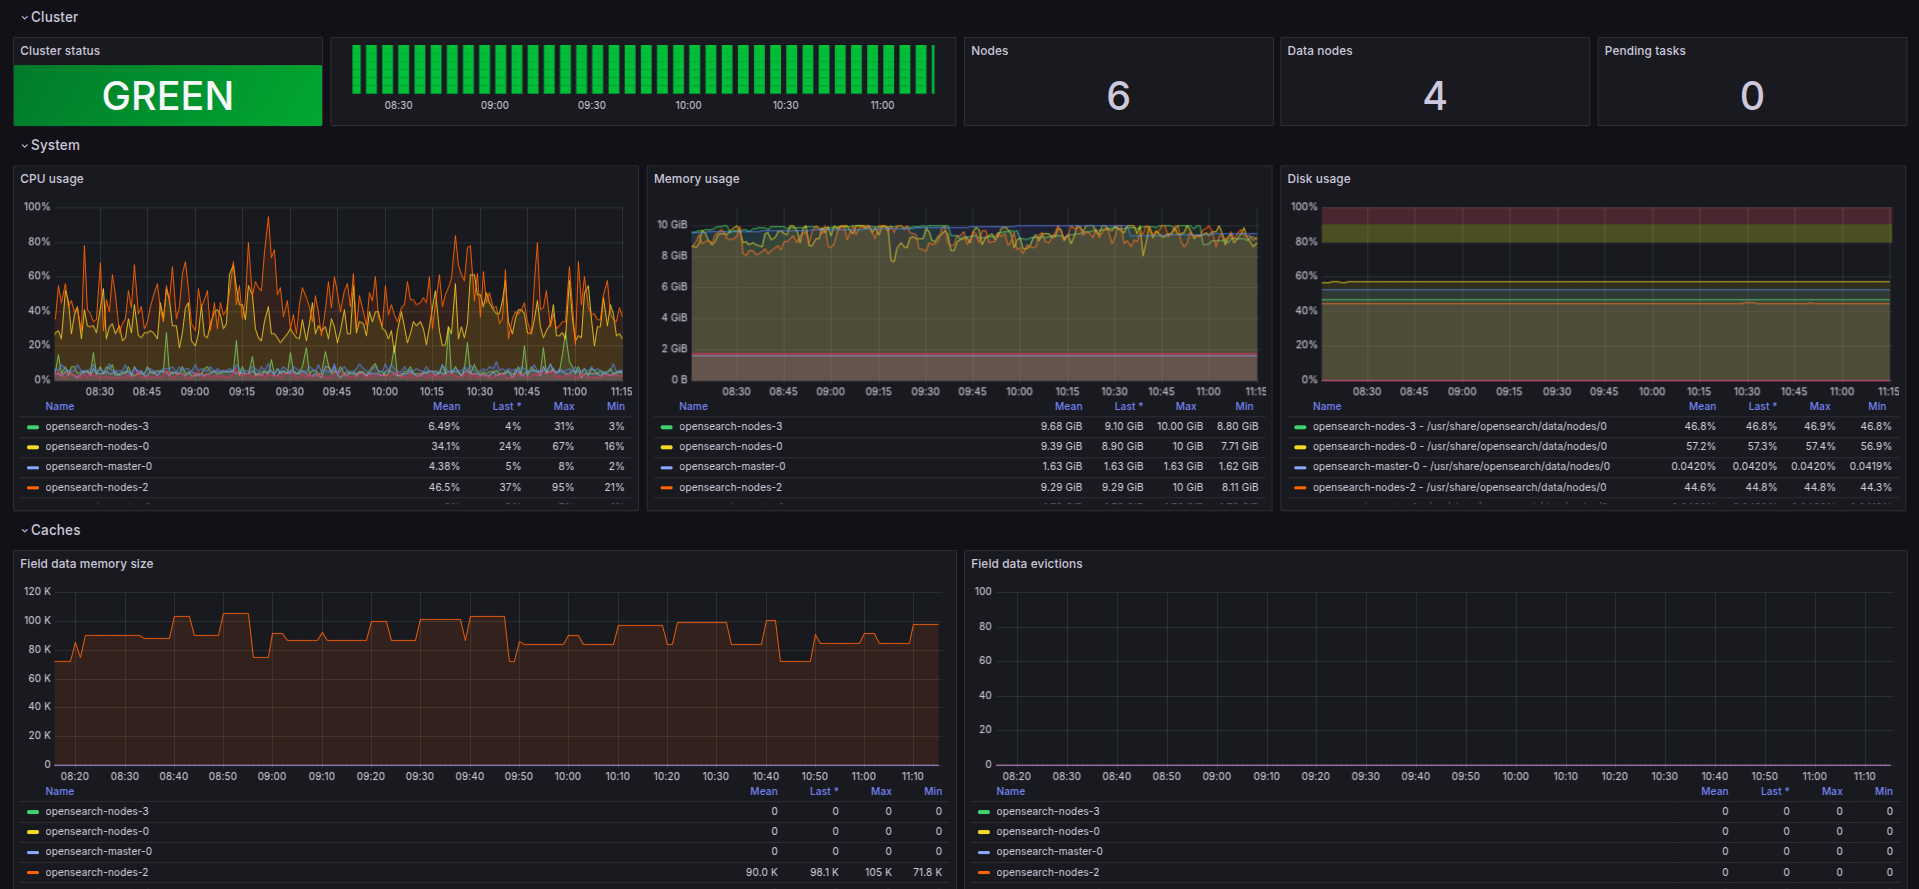
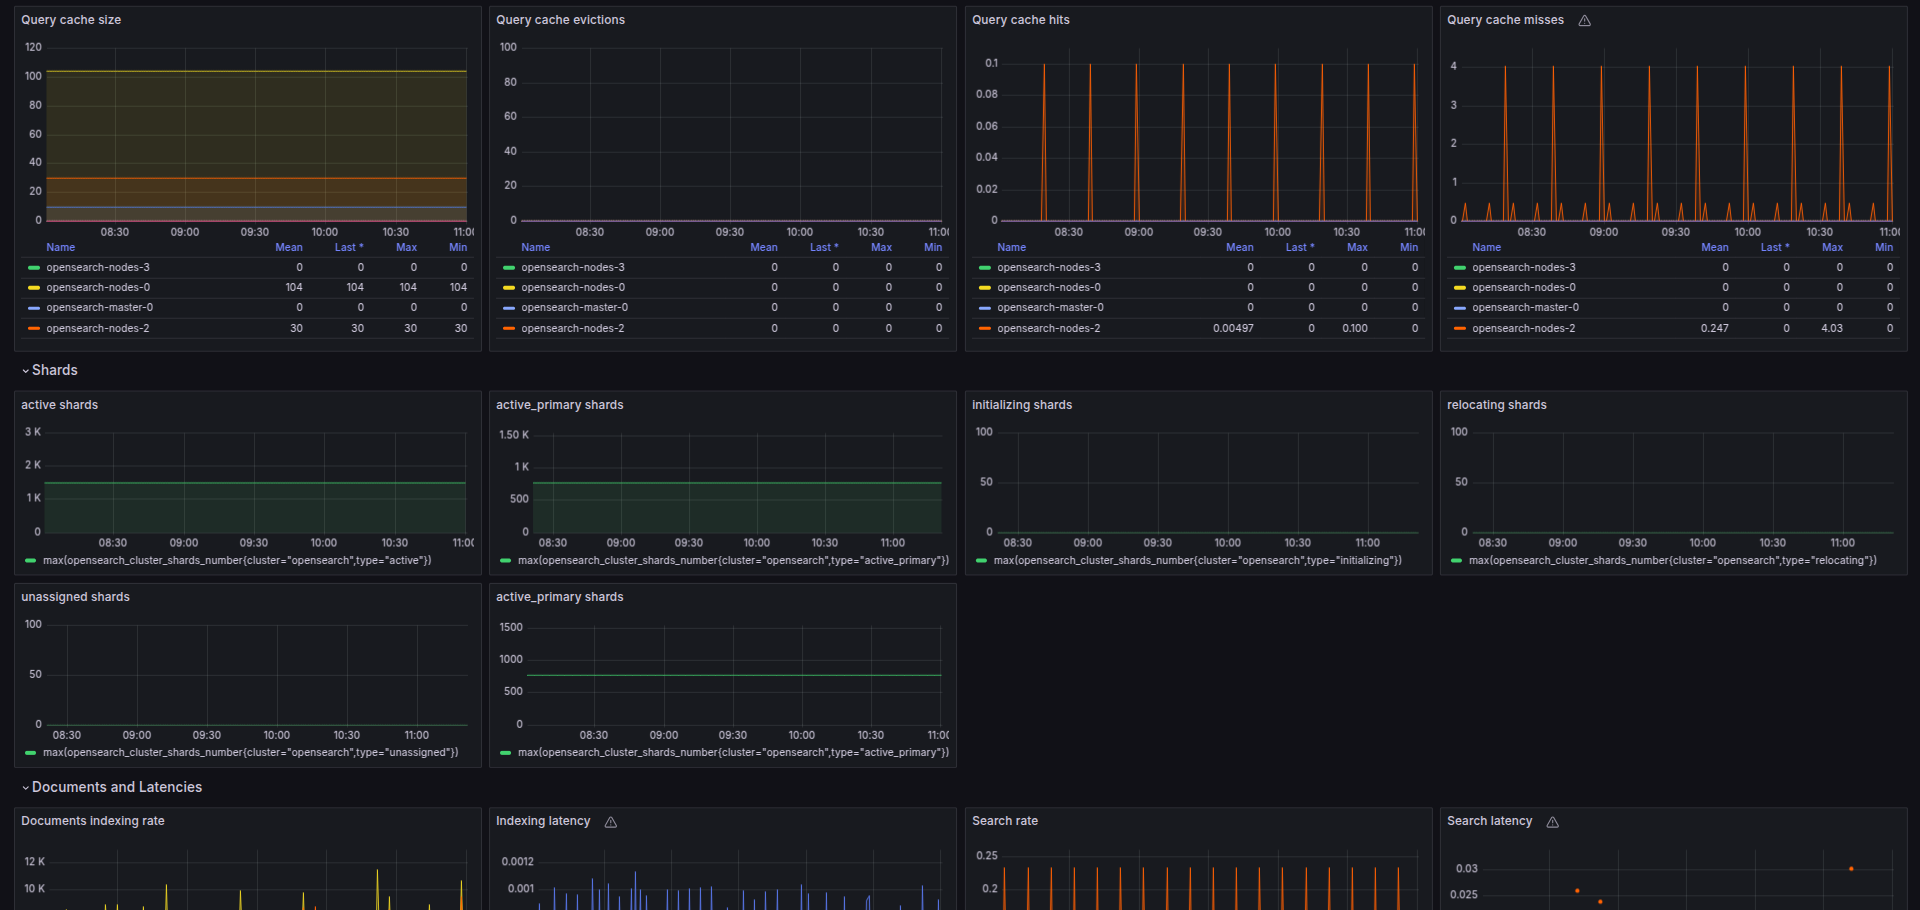
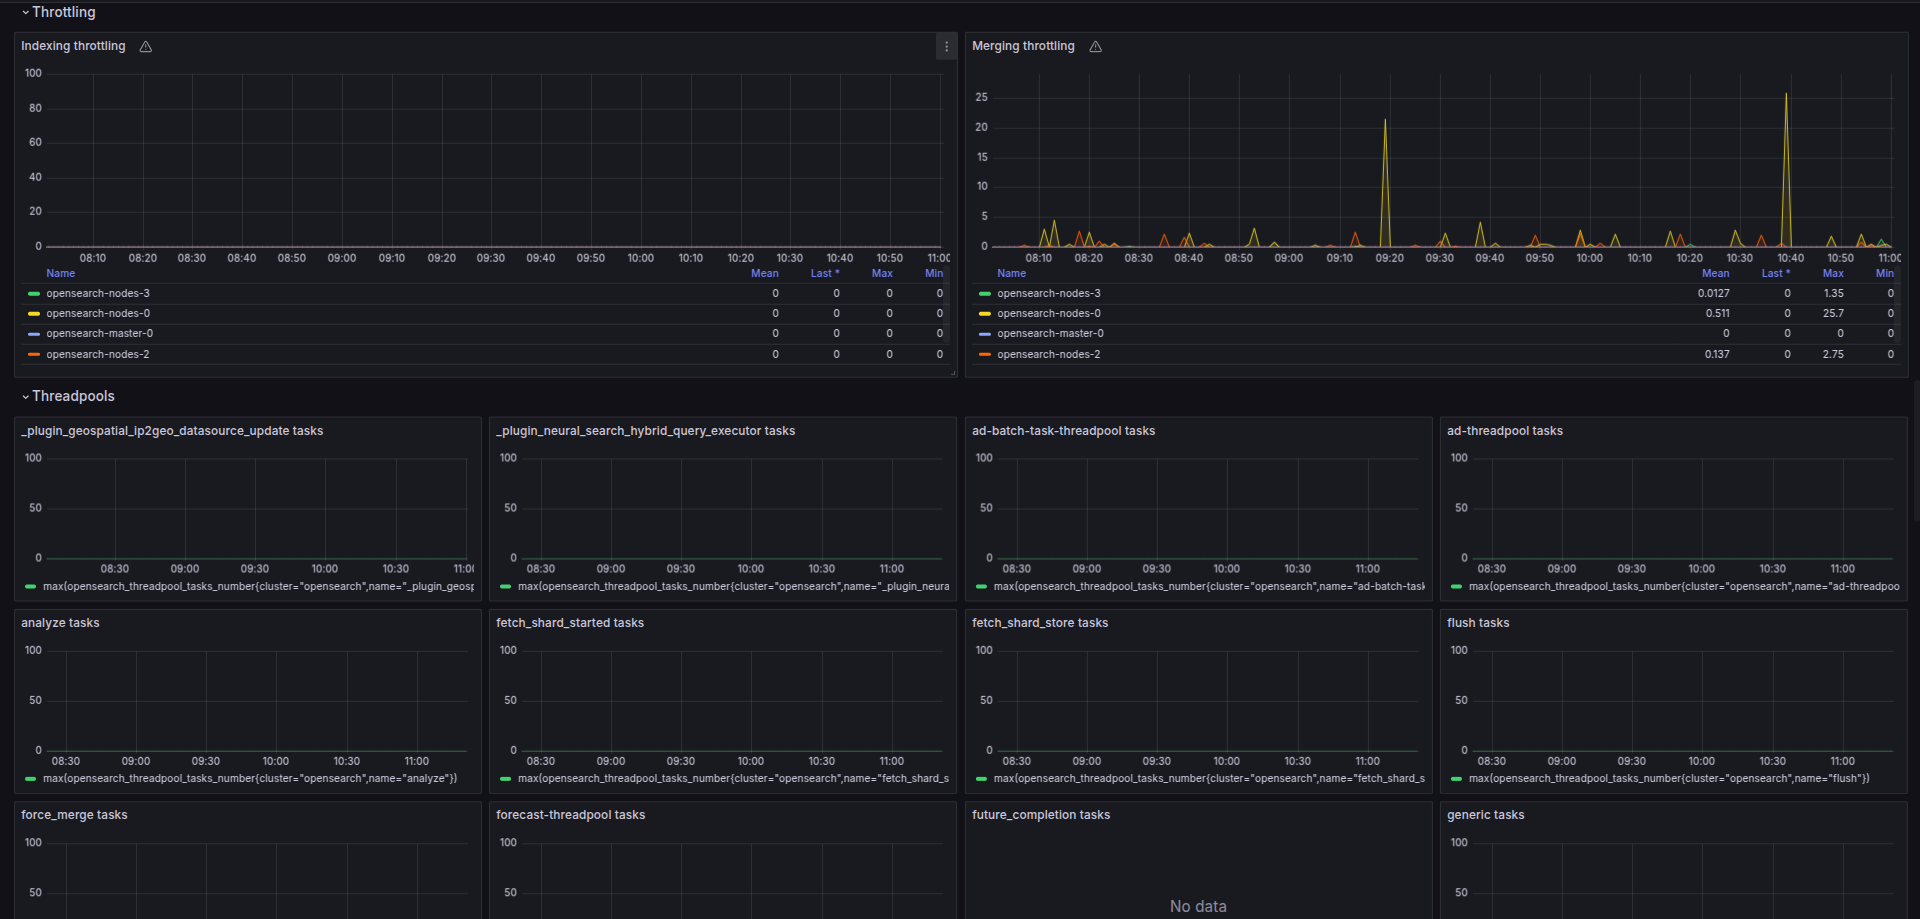
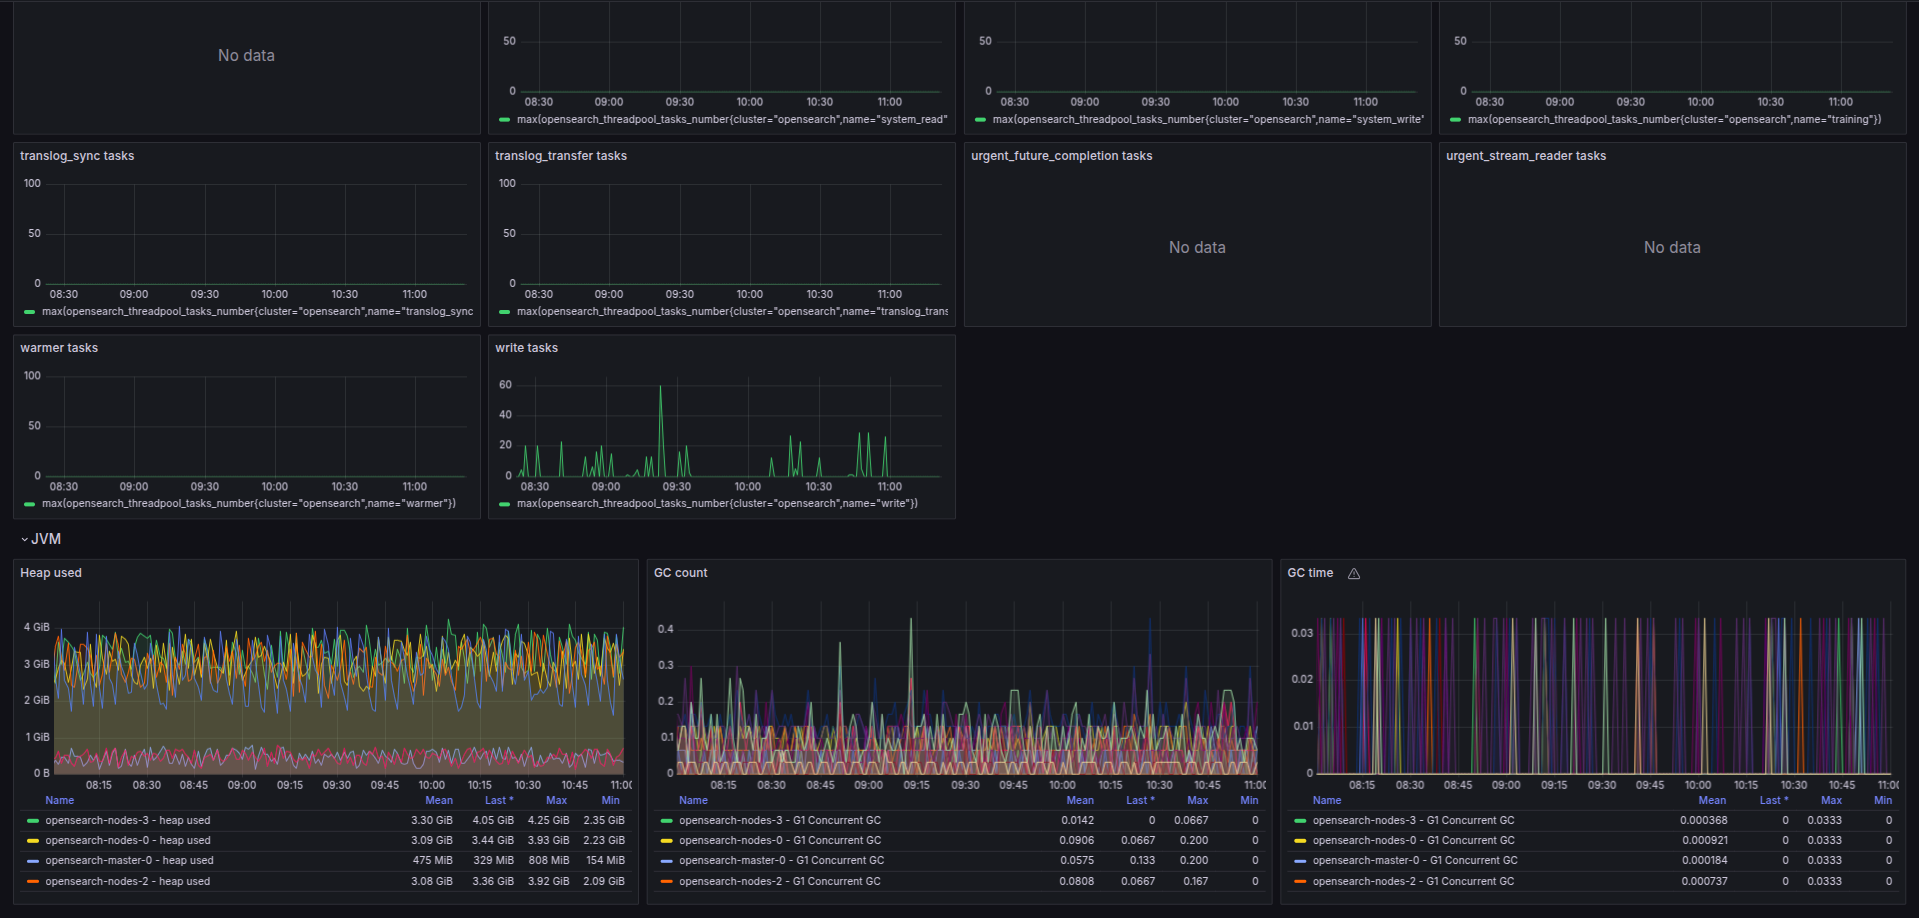
The OpenSearch dashboard uses the prometheus data source to create a Grafana dashboard with the graph, stat and timeseries panels.
Data source config
Collector type:
Collector plugins:
Collector config:
Revisions
Upload an updated version of an exported dashboard.json file from Grafana
| Revision | Description | Created | |
|---|---|---|---|
| Download |
OpenSearch
Easily monitor OpenSearch, an open source software suite for search, analytics, and observability applications, with Grafana Cloud's out-of-the-box monitoring solution.
Learn more