Tuya socket power dashboard
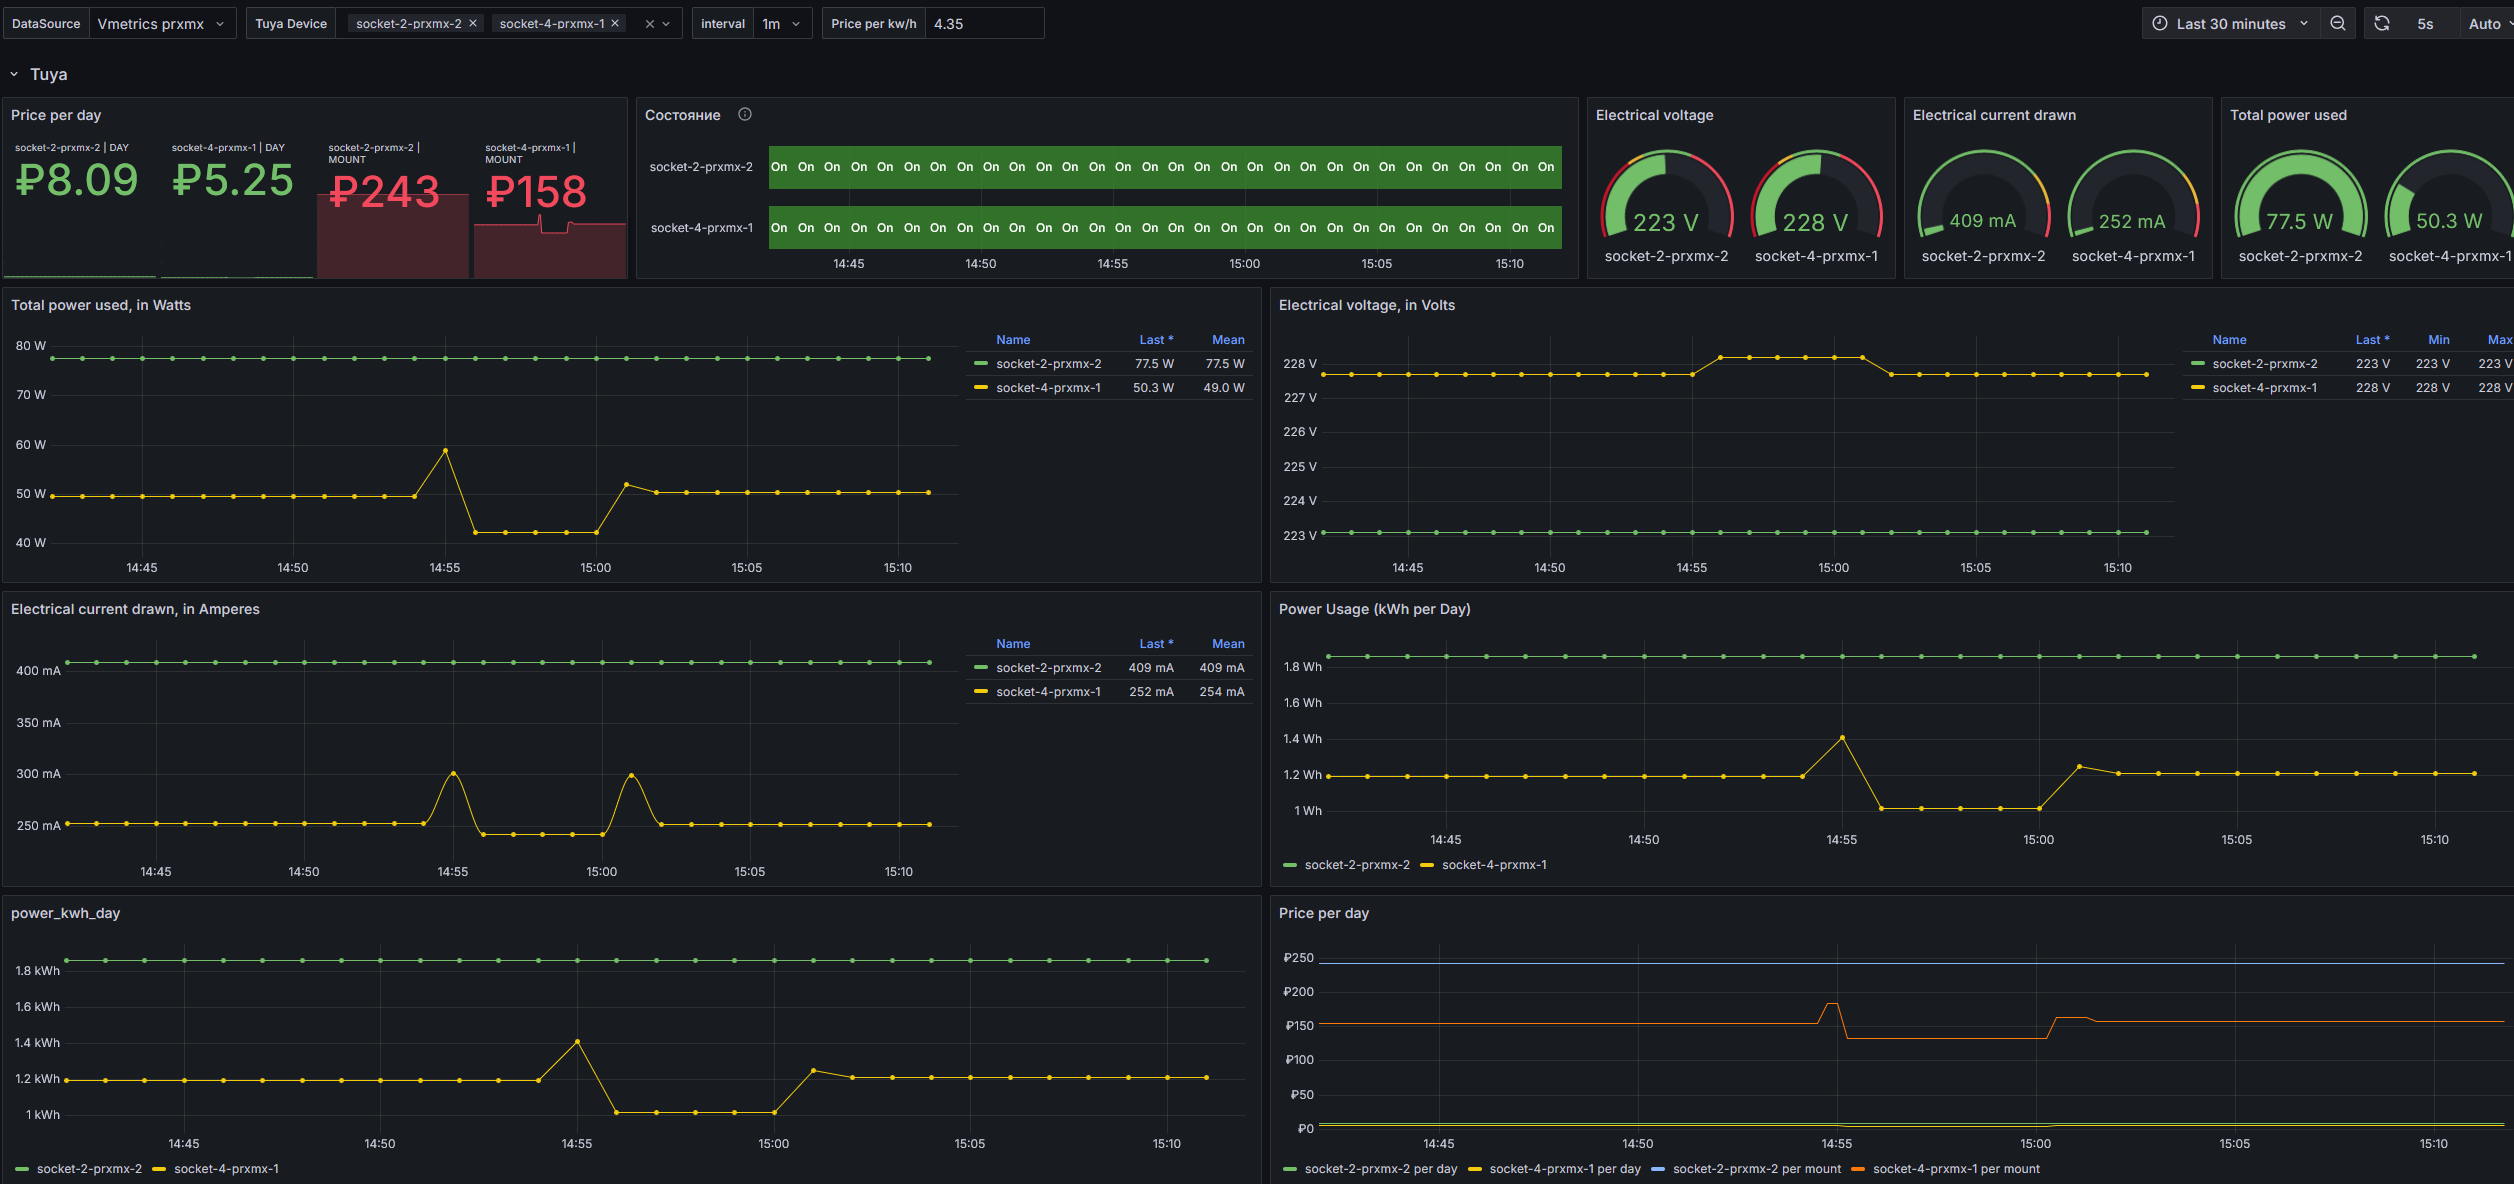
This Grafana dashboard provides real-time monitoring of power consumption using Tuya smart plugs. The data is collected through VictoriaMetrics and visualized for analysis and cost estimation.
https://github.com/Gizex/tuya-smartplug-exporter
Key Dashboard Features:
Daily Power Cost (Price per day) – Displays the estimated electricity cost per day for each monitored smart plug.
Device Status (State) – Shows the on/off status of each plug over time.
Electrical Voltage – Monitors the voltage levels of each plug.
Current Drawn (Amperes) – Displays the amount of electrical current drawn by the connected devices.
Total Power Usage (Watts) – Shows the real-time power consumption of connected devices.
Daily Energy Consumption (kWh per Day) – Visualizes the total energy used per day.
Cost Calculation (Price per kWh) – Computes the daily cost based on the configured electricity rate (4.35 RUB/kWh in this case).
Graphs and Metrics:
Real-time Power Consumption – Tracks wattage usage trends.
Voltage Trends – Logs voltage fluctuations over time.
Current Draw Trends – Displays how the electrical current varies.
Daily kWh Consumption – Shows cumulative energy usage throughout the day.
Cost Analysis Over Time – Displays variations in electricity costs.
Additional Features:
Real-time data updates with a 1-minute interval.
Visual indicators for quick status monitoring.
Cost optimization insights based on power usage.
This dashboard provides an efficient way to track power consumption and optimize electricity costs for Tuya smart plugs.
Data source config
Collector type:
Collector plugins:
Collector config:
Revisions
Upload an updated version of an exported dashboard.json file from Grafana
| Revision | Description | Created | |
|---|---|---|---|
| Download |