Openshift GitOps (ArgoCD) Dashboard
Monitor ArgoCD applications on OpenShift, including sync status, memory/CPU usage, gRPC calls, errors, and repositories using Grafana.
Openshift GitOps (ArgoCD) Dashboard - V1
📌 DESCRIPTION
This OpenShift GitOps Dashboard is designed to monitor ArgoCD applications’ synchronization status, memory & CPU usage, gRPC calls, error codes, and repository management using Grafana. Failed Syncs, application health status, and critical ArgoCD indicators are analyzed in detail on this dashboard.
🛠 INCLUDED PANELS
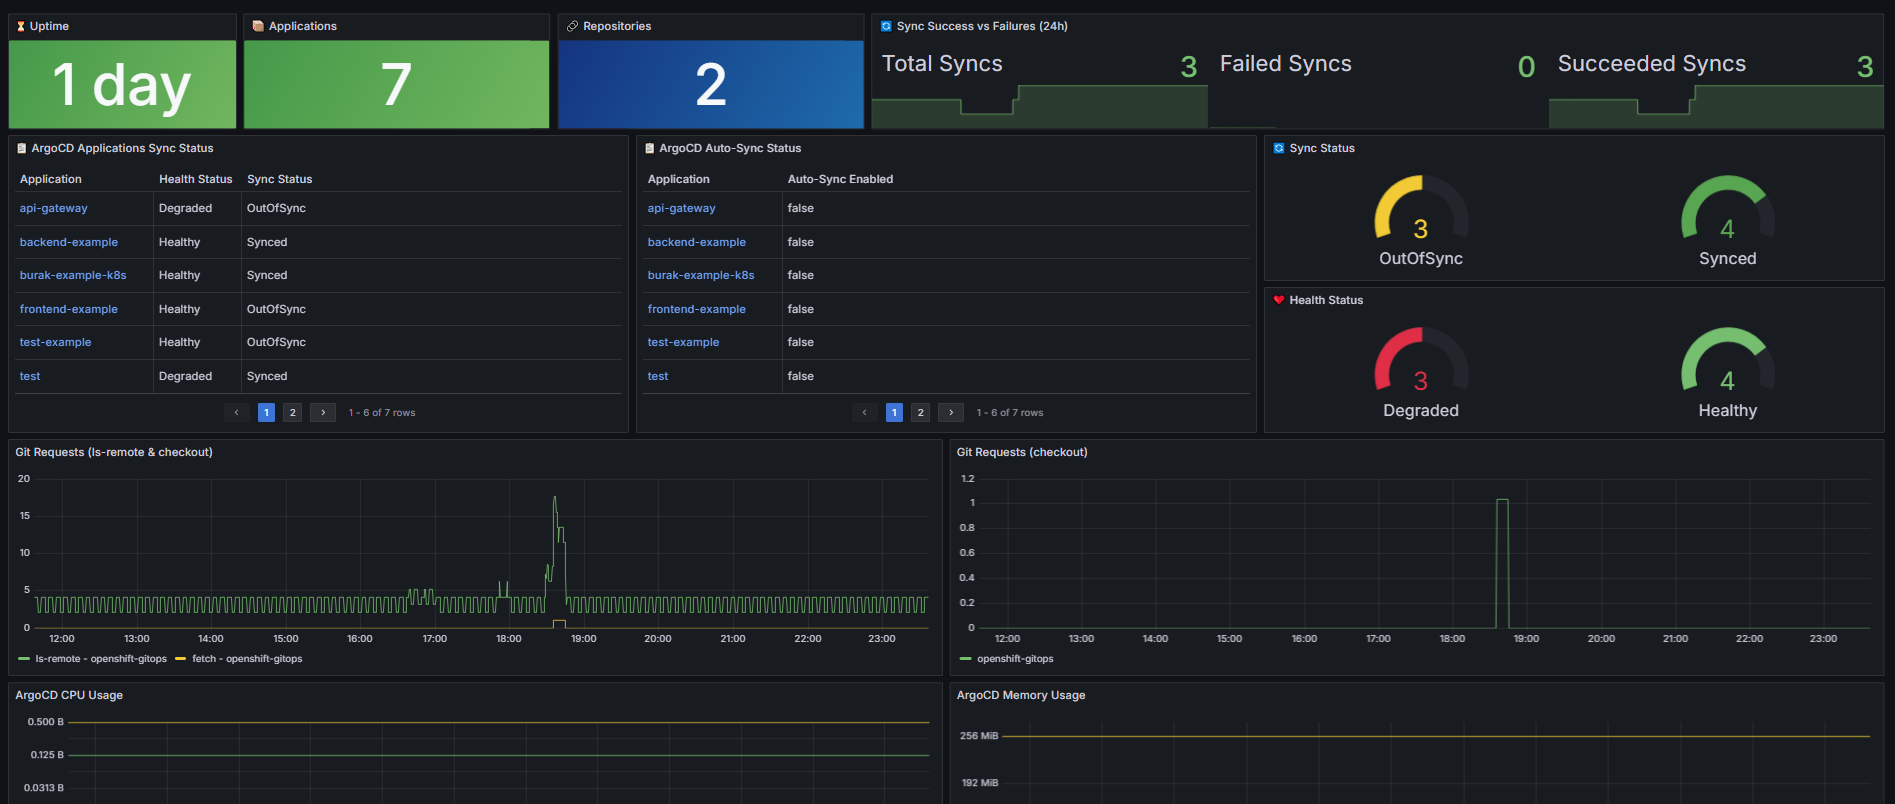
- ⏳ UPTIME → Shows how long the ArgoCD server has been running.
- 📦 APPLICATIONS → Lists ArgoCD applications running on OpenShift.
- 🔗 REPOSITORIES → Tracks Git repositories connected to ArgoCD.
- 🔄 SYNC STATUS → Displays application synchronization status (Synced, OutOfSync, Error, etc.).
- ❤️ HEALTH STATUS → Shows the health status of applications (Healthy, Degraded, Missing, etc.).
- 📋 ARGOCD APPLICATIONS SYNC STATUS → Provides a table view of applications and their synchronization status.
- 🔄 SYNC SUCCESS VS FAILURES (24H) → Compares successful vs. failed syncs in the last 24 hours.
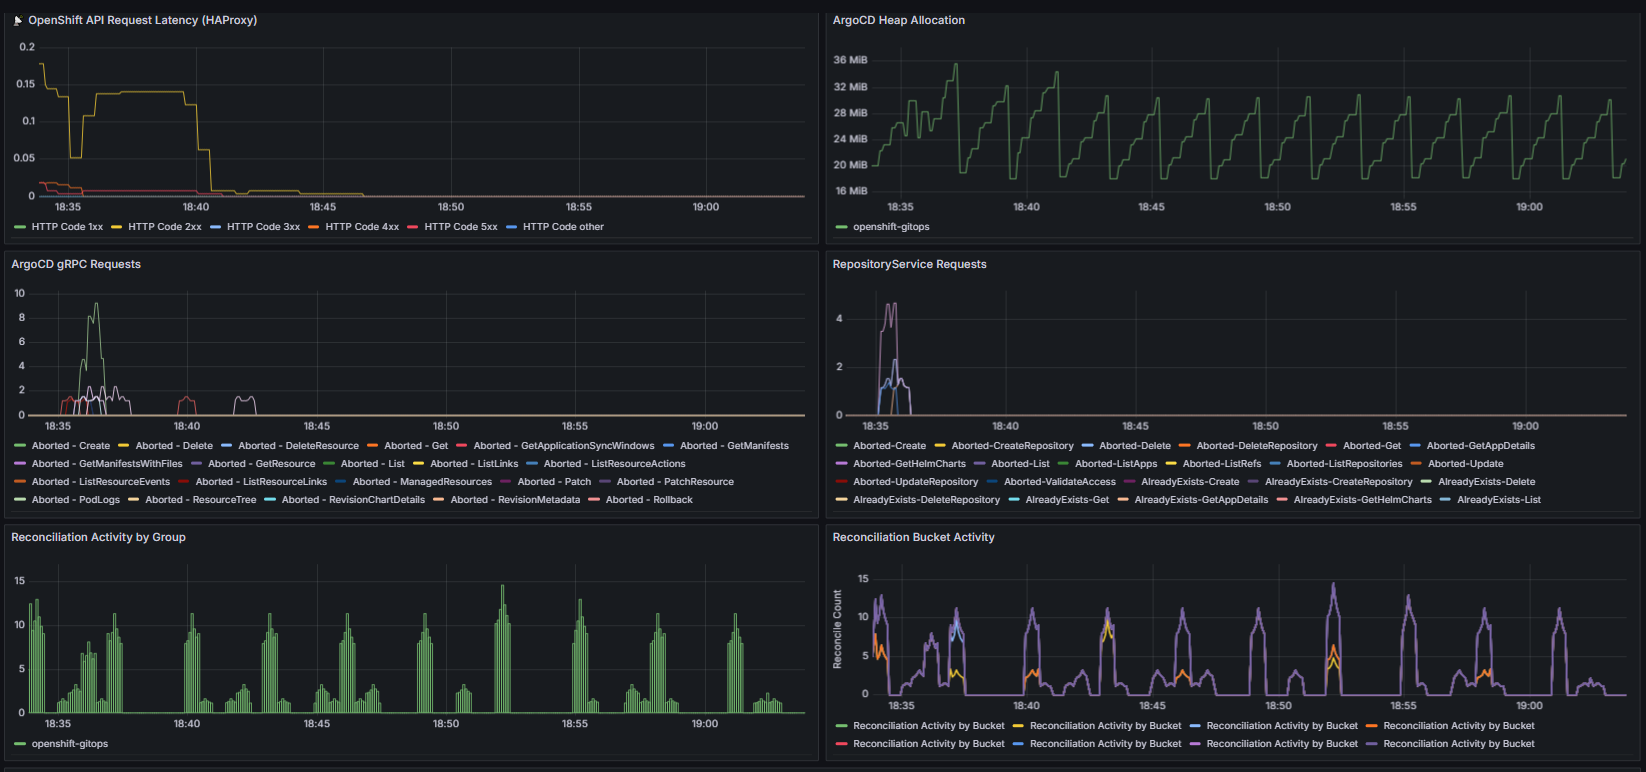
- 🔥 ARGOCD CPU & MEMORY USAGE → Measures the memory and CPU usage of the ArgoCD server.
- 📡 OPENSHIFT API REQUEST LATENCY (HAPROXY) → Monitors OpenShift API request latency.
- 📊 GRPC CALLS & ERRORS → Shows detailed gRPC calls and error codes for ArgoCD.
- 📋 AUTO-SYNC STATUS → Displays ArgoCD's auto-sync status.
- 🛠 REDIS & GIT REQUESTS → Monitors Redis and Git requests made by ArgoCD.
🚀 SETUP & USAGE
- Go to the "Dashboards" section in Grafana
- Select the "Import" option
- Upload the JSON file or paste its content
- Select your data source (Prometheus)
- Save the dashboard and start monitoring!
🔗 GITHUB REPOSITORY
For updates, contributions, and issue tracking, visit:
OpenShift GitOps Dashboard on GitHub
Data source config
Collector type:
Collector plugins:
Collector config:
Revisions
Upload an updated version of an exported dashboard.json file from Grafana
| Revision | Description | Created | |
|---|---|---|---|
| Download |