TrueNAS CORE v13
Replicates the TrueNAS CORE "Reporting" metrics and expects a Graphite data source.
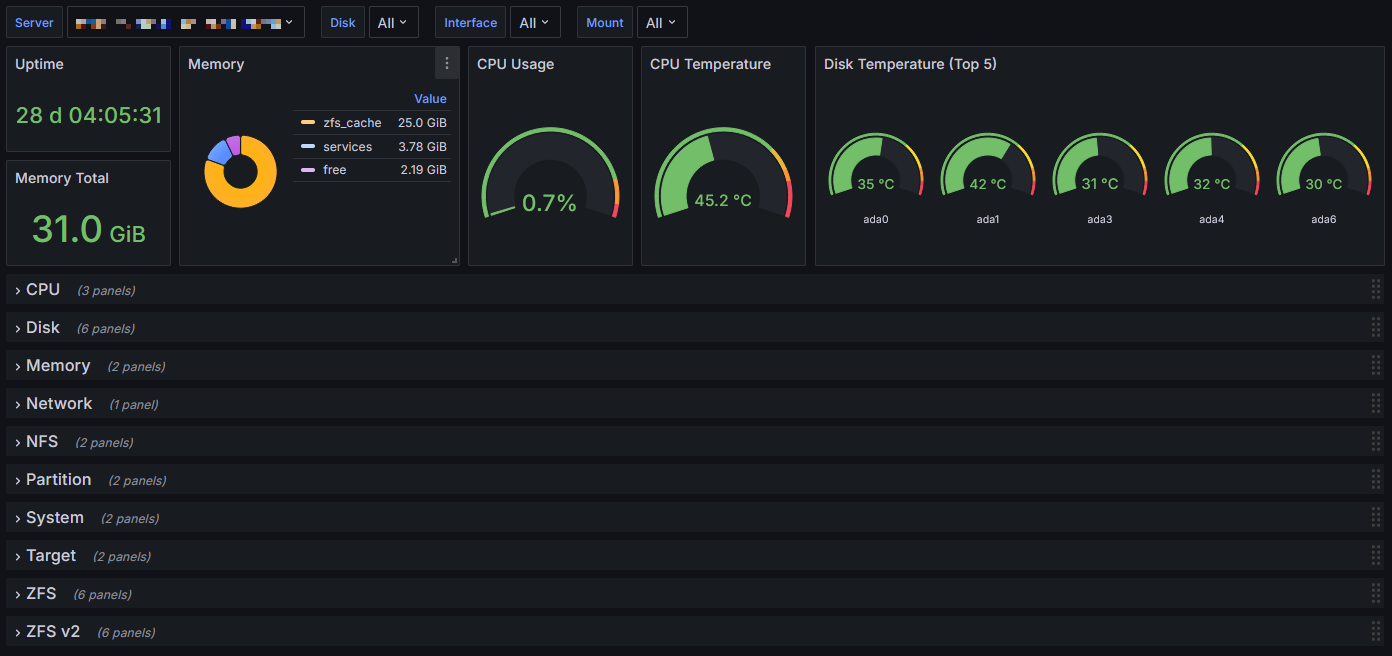
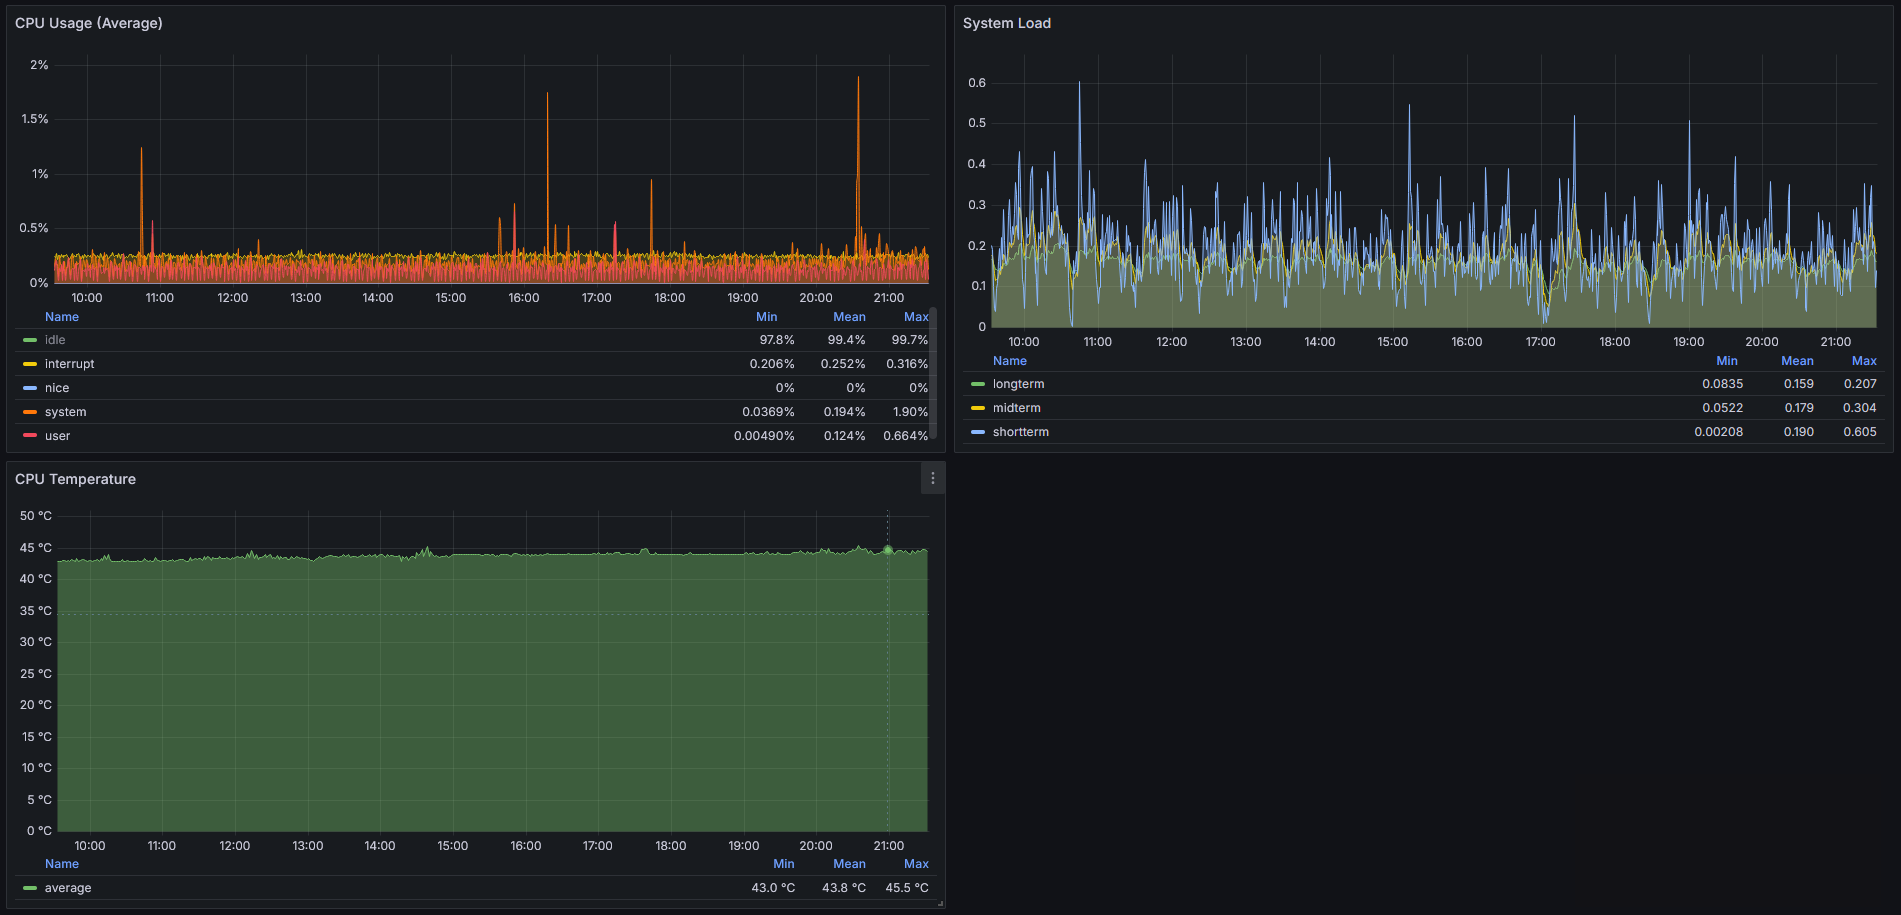
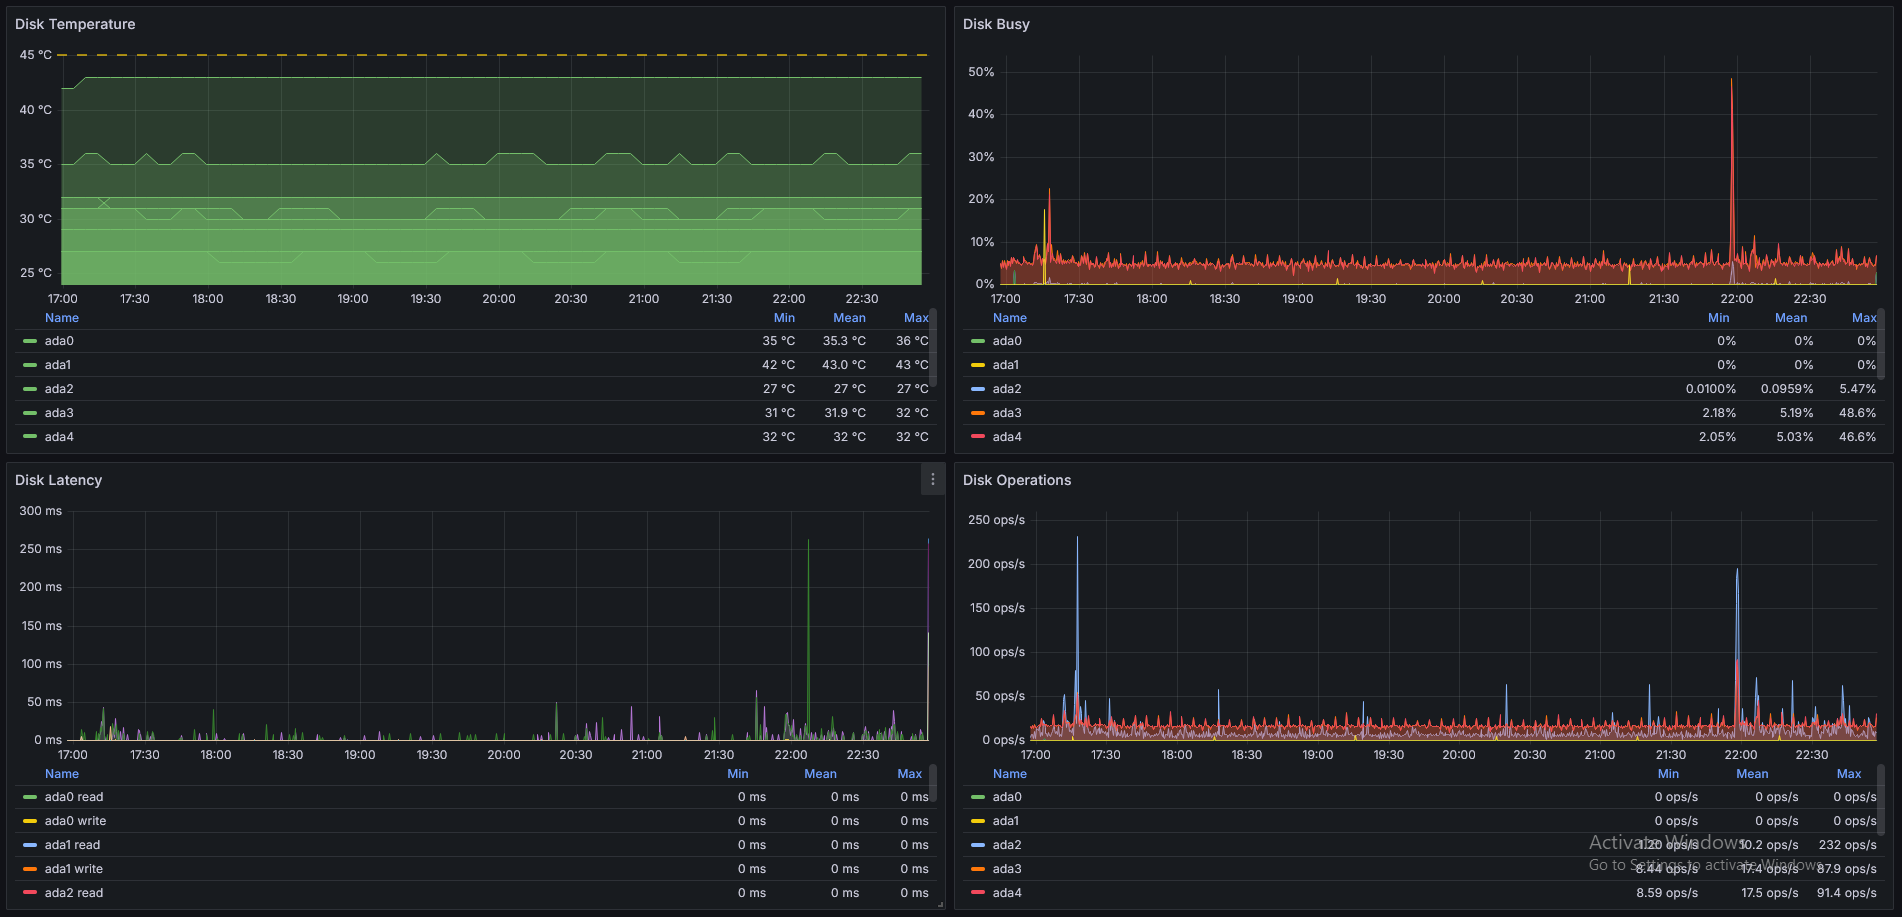
This dashboard aims to replicate most of the metrics shown in the Reporting and Dashboard sections of the TrueNAS CORE (formally FreeNAS) web interface. It has been tested with v13 but may work with older versions as well.
TrueNAS CORE sends metrics using the Graphite protocol, and the dashboard requires a Graphite data source. VictoriaMetrics is a simple way to setup a receiver for Graphite metrics which also has the Graphite API support Grafana requires.
The dashboard is also available from https://github.com/chrisred/grafana-truenas.
Setup
Configure the TrueNAS Graphite options under System > Reporting, check both "Report CPU usage in percent" and "Graphite Separate Instances".
Create a Graphite data source in Grafana, using VictoriaMetrics (or another solution) as the source.
Import the dashboard via the Dashboards > New > Import option in Grafana.
Data source config
Collector config:
Upload an updated version of an exported dashboard.json file from Grafana
| Revision | Description | Created | |
|---|---|---|---|
| Download |