Sbnb Linux / CPU, Temp, FAN, Watt
Displays real-time CPU load, IPMI temperature, fan speed, and power consumption for performance and efficiency monitoring.
Run Grafana Monitoring under Sbnb Linux
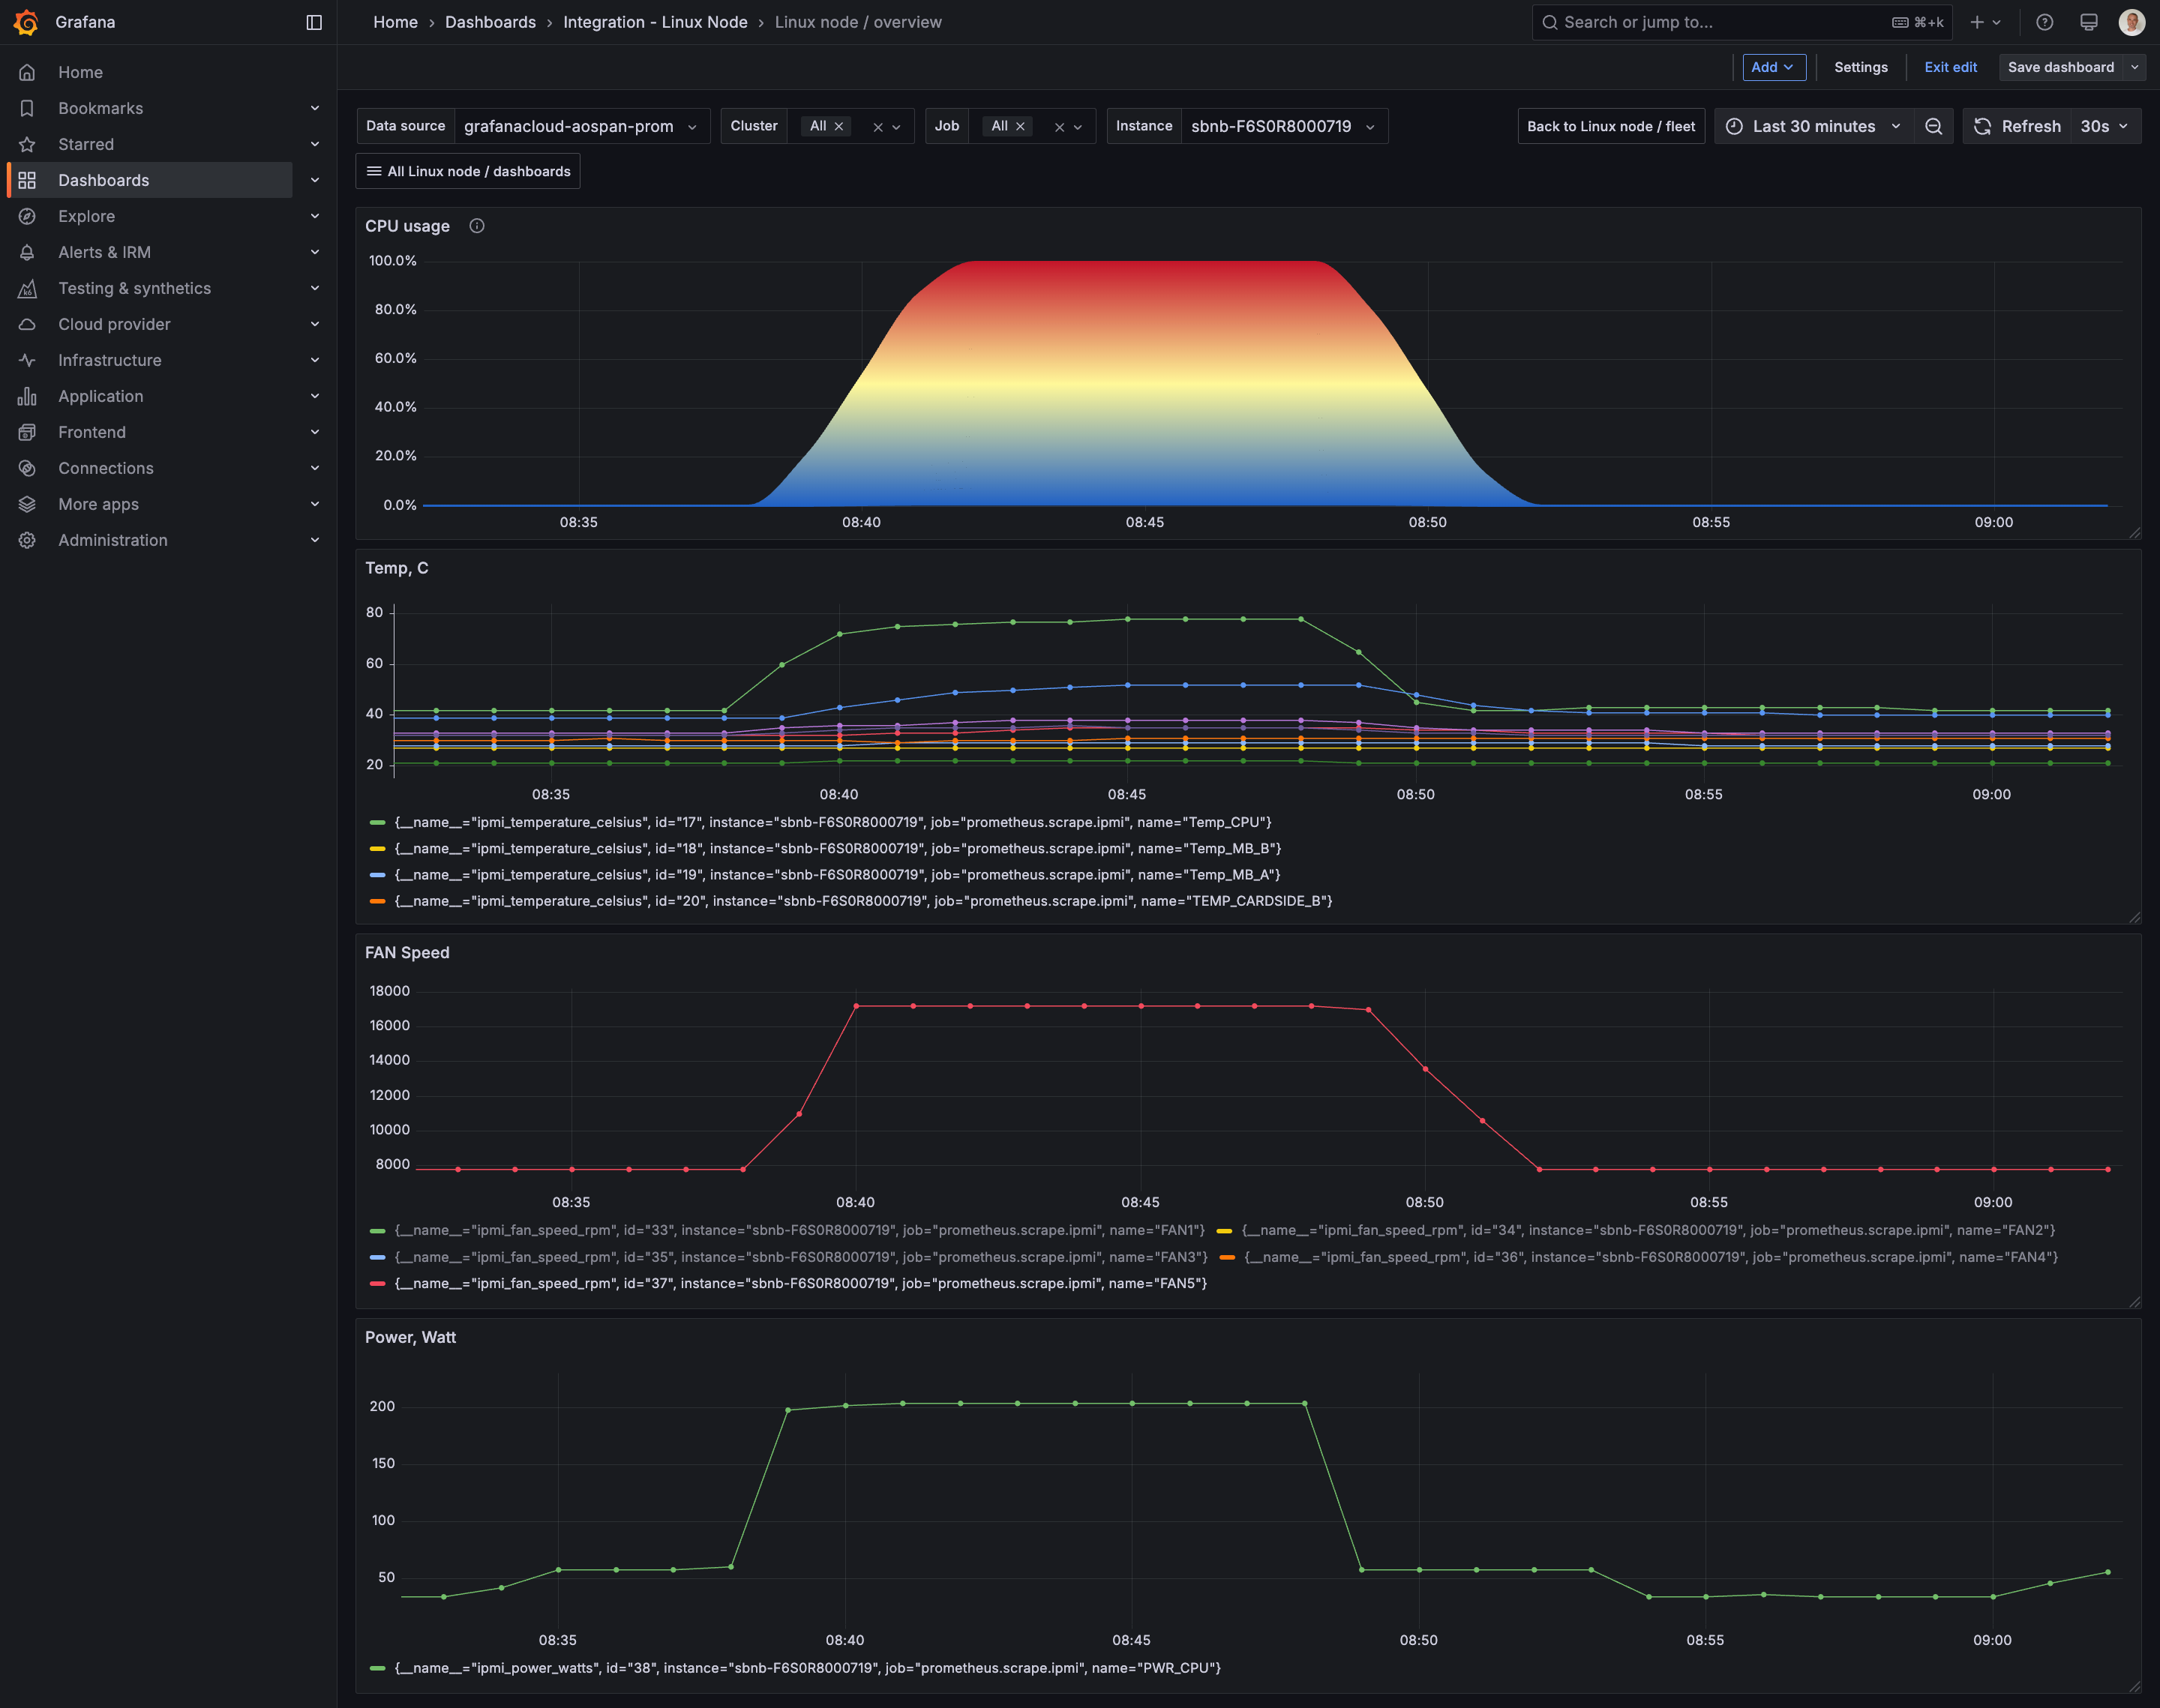
This tutorial will show how to get a Bare Metal server up & running with CPU Temperature, Fan speed, and Power consumption (Watt) monitoring using Grafana in minutes with Sbnb Linux. At the end, you will be able to see the following monitoring graphs from your Bare Metal server. The graph below shows a CPU stress test for 10 minutes, leading to a CPU load spike to 100%, a temperature rise from 40°C to around 80°C, a Fan speed increase from 8000 RPM to 18000 RPM, and power consumption rising from 50 Watts to 200 Watts.
Prerequisites
- Boot Bare Metal server into Sbnb Linux. Read more at README-INSTALL.md.
- Laptop with Tailscale configured to access the bare metal server for configuration.
Howto
1. Boot Bare Metal Server into Sbnb Linux
Boot the Bare Metal server into Sbnb Linux using the instructions in README-INSTALL.md. After booting, verify that the server appears in your Tailscale machine list.
For more details on automatic hostname assignments, refer to README-SERIAL-NUMBER.md.
2. Connect Your Laptop to Tailscale
We will use a MacBook in this tutorial, but any machine, such as a Linux instance, should work the same.
3. Download Tailscale Dynamic Inventory Script
curl https://raw.githubusercontent.com/m4wh6k/ansible-tailscale-inventory/refs/heads/main/ansible_tailscale_inventory.py -O
chmod +x ansible_tailscale_inventory.py
4. Pull Grafana Alloy Config and Ansible Playbook
curl -O https://raw.githubusercontent.com/sbnb-io/sbnb/refs/heads/main/misc/grafana.yaml
curl -O https://raw.githubusercontent.com/sbnb-io/sbnb/refs/heads/main/misc/ansible.cfg
curl -O https://raw.githubusercontent.com/sbnb-io/sbnb/refs/heads/main/misc/config.alloy
5. Set environment variables
export SBNB_HOSTS=sbnb-F6S0R8000719
export GRAFANA_URL="https://prometheus-prod-13-prod-us-east-0.grafana.net/api/prom/push"
export GRAFANA_USERNAME="1962802"
export GRAFANA_PASSWORD="glc_<REDACTED>"
Replace GRAFANA_URL, GRAFANA_USERNAME, and GRAFANA_PASSWORD with your own credentials, which you can obtain from your Grafana Cloud account under:
Home -> Connections -> Data sources -> Your Prometheus Data Source -> Authentication
6. Run Ansible Playbook
ansible-playbook -i ./ansible_tailscale_inventory.py grafana.yaml
A successful output should look like this:
# ansible-playbook -i ./ansible_tailscale_inventory.py grafana.yaml
PLAY [sbnb-F6S0R8000719] **********************************************************************************************************************
TASK [ping] ***********************************************************************************************************************************
ok: [sbnb-F6S0R8000719]
TASK [Copy Grafana config] ********************************************************************************************************************
ok: [sbnb-F6S0R8000719]
TASK [Check if "/dev/ipmi0" exists] ************************************************************************************************************
ok: [sbnb-F6S0R8000719]
TASK [Start an ipmi-exporter container] ********************************************************************************************************
ok: [sbnb-F6S0R8000719]
TASK [Start a Grafana Alloy container] ********************************************************************************************************
changed: [sbnb-F6S0R8000719]
PLAY RECAP ************************************************************************************************************************************
sbnb-F6S0R8000719          : ok=5    changed=1    unreachable=0    failed=0    skipped=0    rescued=0    ignored=0
7. Import Grafana Dashboard and Start Monitoring Your Bare Metal Server!
Import this Grafana dashboard created for simplicity. It displays CPU load and metrics gathered from IPMI, such as various component temperatures, Fan speed, and power consumption in Watts.
Data source config
Collector config:
Upload an updated version of an exported dashboard.json file from Grafana
| Revision | Description | Created | |
|---|---|---|---|
| Download |
Linux Server
Monitor Linux with Grafana. Easily monitor your Linux deployment with Grafana Cloud's out-of-the-box monitoring solution.
Learn more