Grafana Dashboard for Open WebUI
A complete, opensource dashboard that shows consumption and usage of Open WebUI.
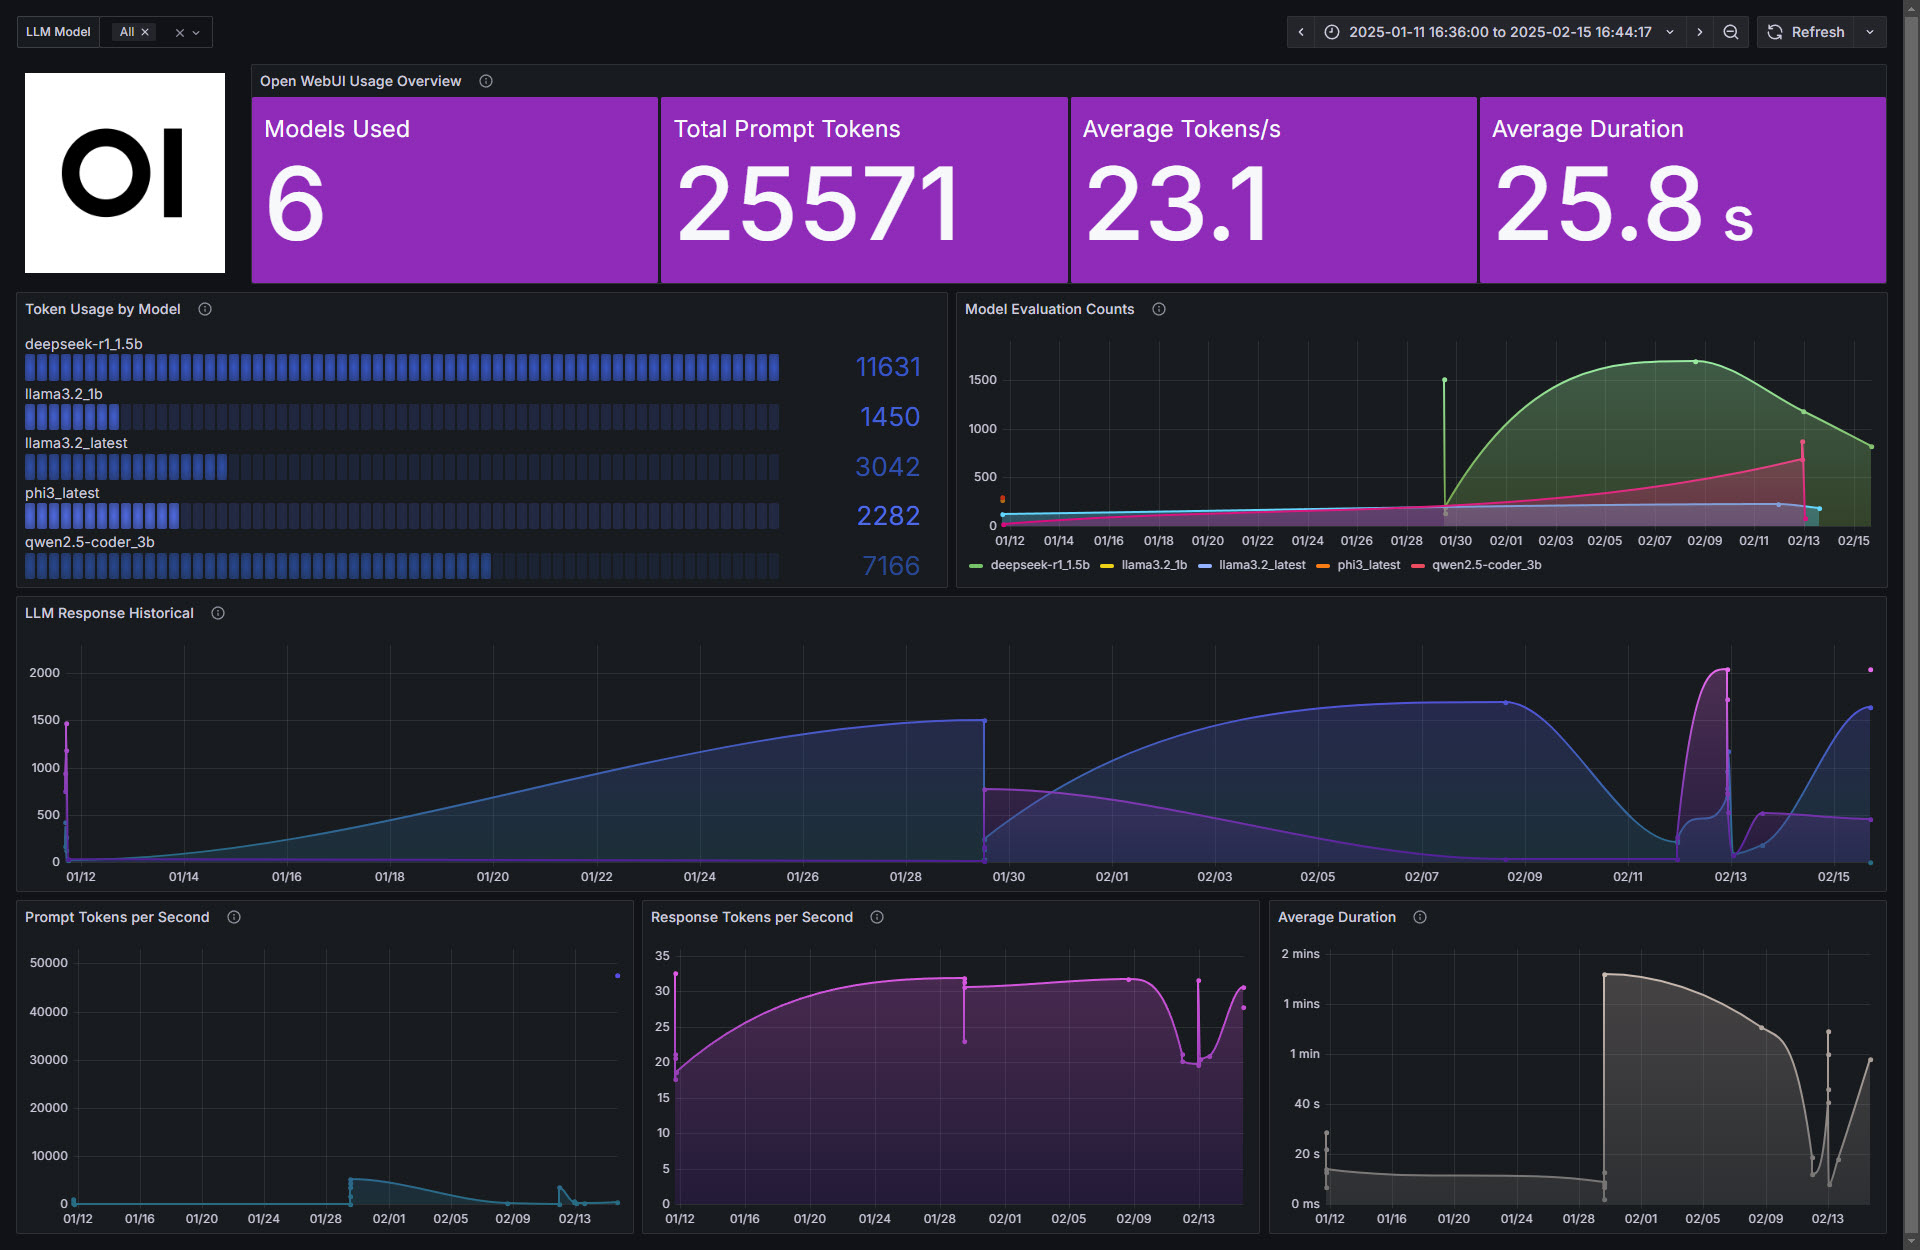
This dashboard contains multiples sections with the goal to monitor a full Open WebUI and the LLM models that run locally.

Dashboard – Summary
- Quick overview (Models used, Total prompt tokens, Average Token/s, Average duration)
- Total usage by model
- Model usage historical per model
- Total usage historical
- Prompt Tokens per second historical
- Response Tokens per second historical
- Average response duration historical
Data source config
Collector type:
Collector plugins:
Collector config:
Revisions
Upload an updated version of an exported dashboard.json file from Grafana
| Revision | Description | Created | |
|---|---|---|---|
| Download |