Kubernetes / Networking / Retina (Standard) / DNS
Retina Network Observability visualize metrics for any Kubernetes cluster using [Retina](https://retina.sh/) (any cloud provider, any CNI, any OS). This dashboard provides DNS metrics.
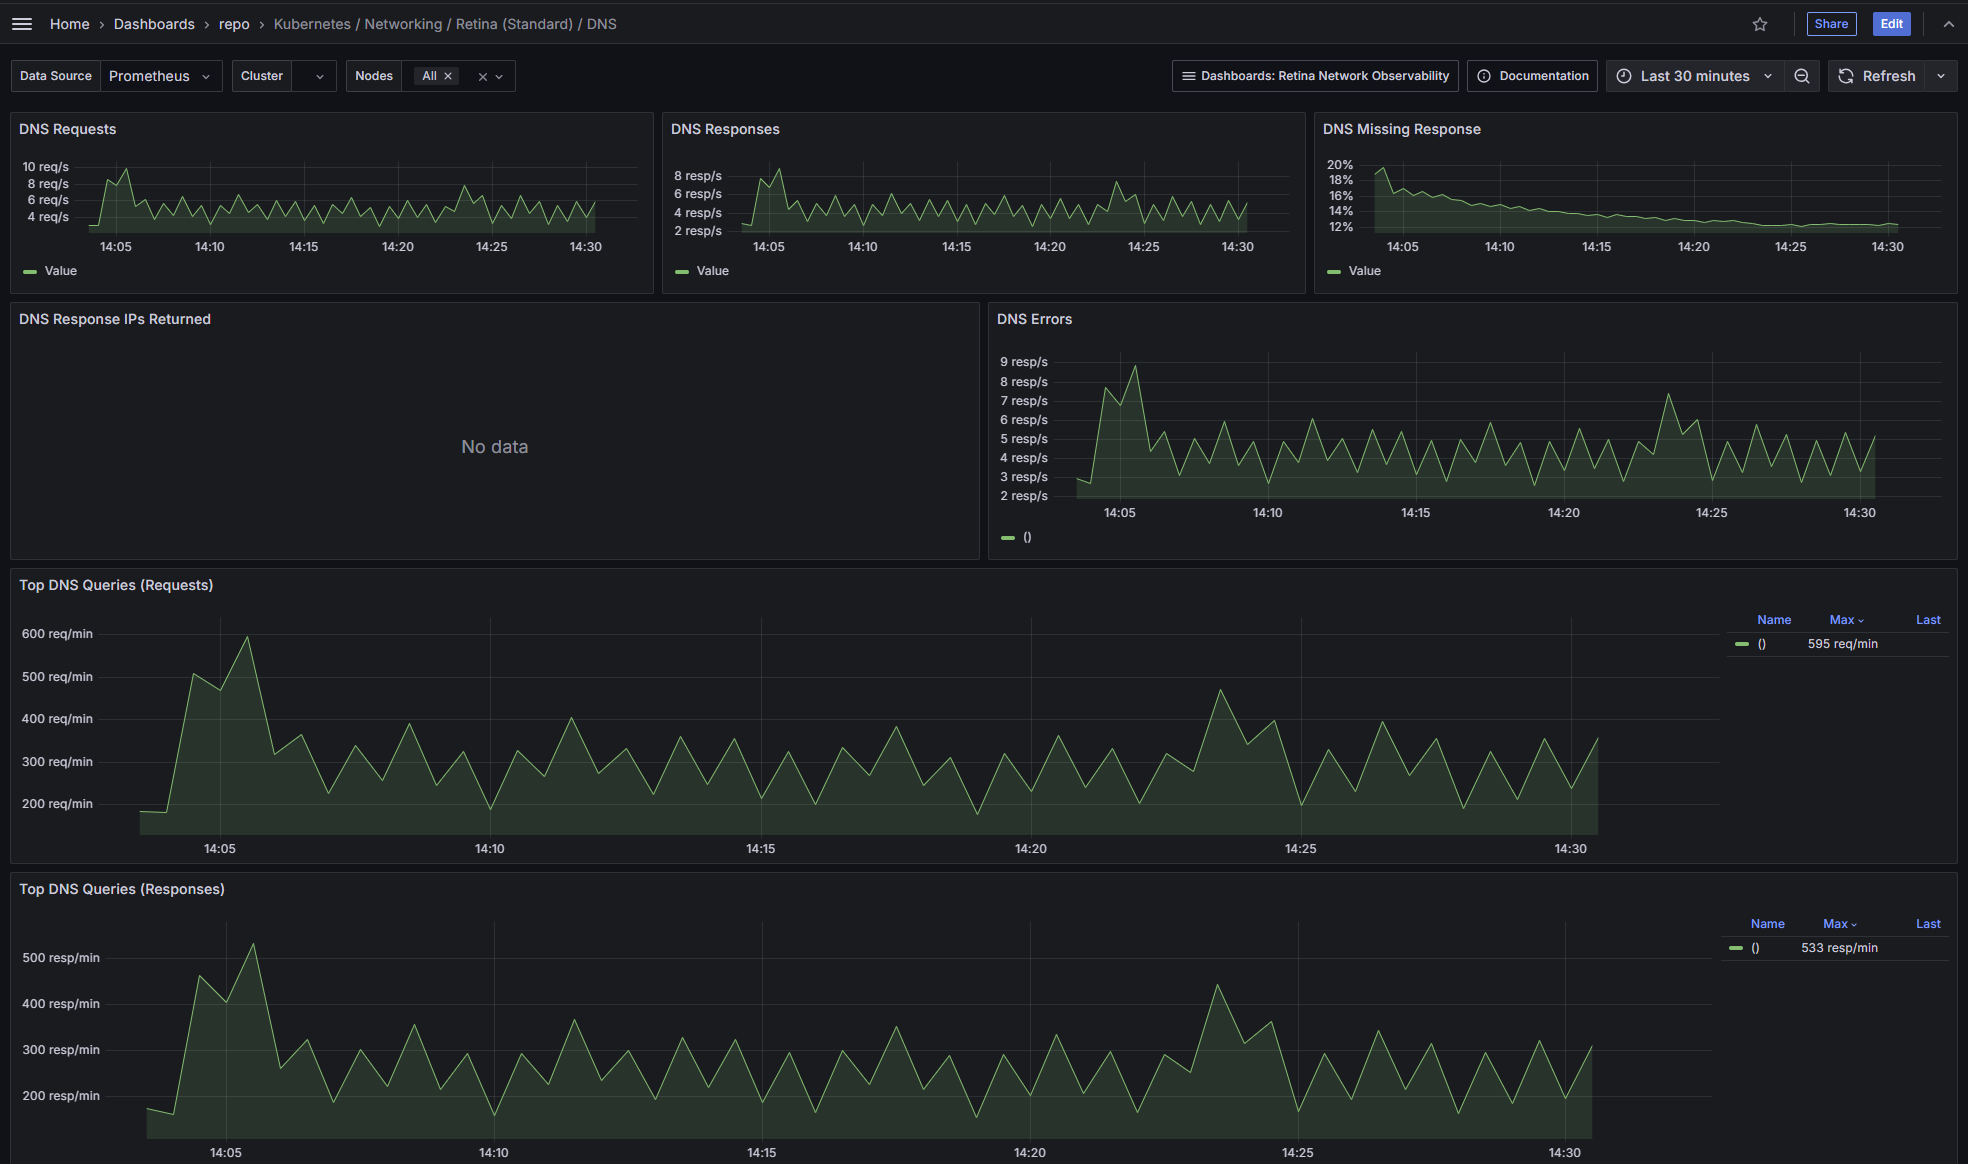
The Kubernetes / Networking / Retina (Standard) / DNS dashboard uses the prometheus data source to create a Grafana dashboard with the table and timeseries panels.
Data source config
Collector type:
Collector plugins:
Collector config:
Revisions
Upload an updated version of an exported dashboard.json file from Grafana
| Revision | Description | Created | |
|---|---|---|---|
| Download |
Kubernetes
Monitor your Kubernetes deployment with prebuilt visualizations that allow you to drill down from a high-level cluster overview to pod-specific details in minutes.
Learn more