XRPL EVM Dashboard by Cumulo
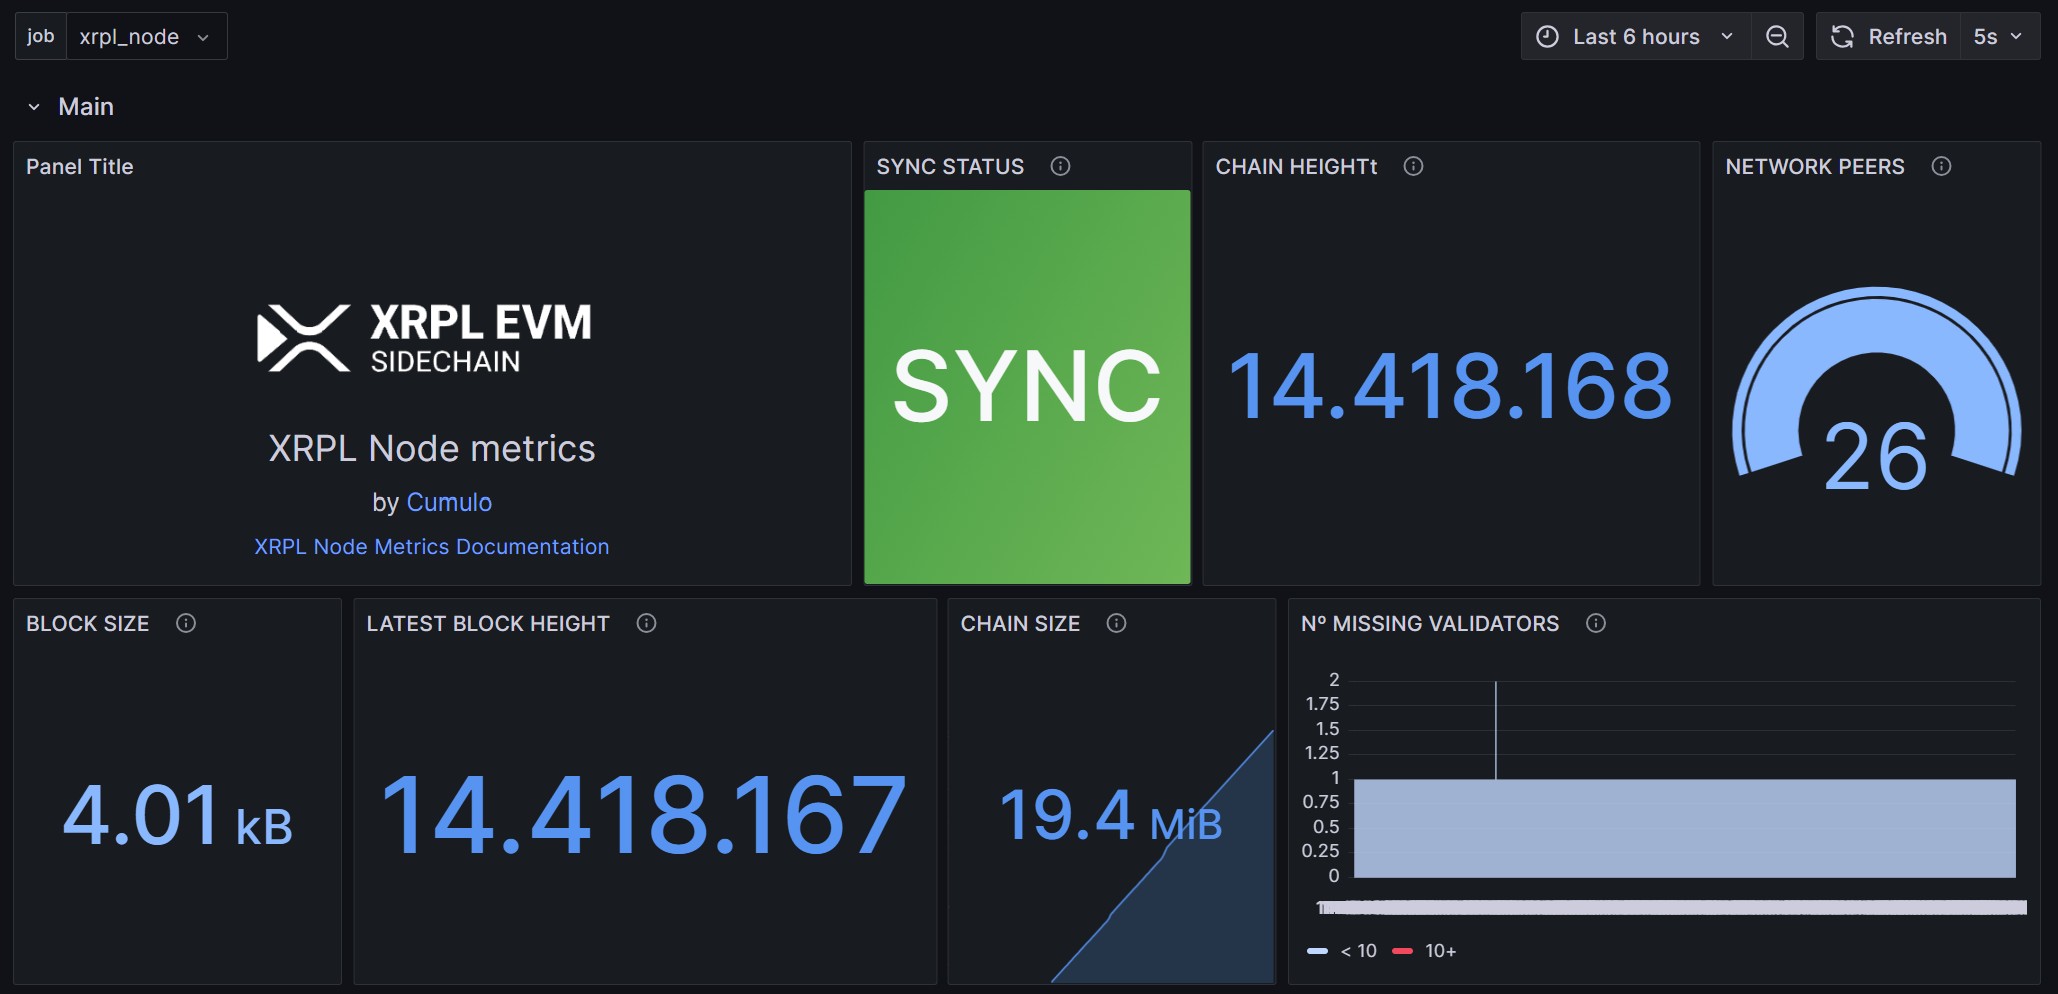
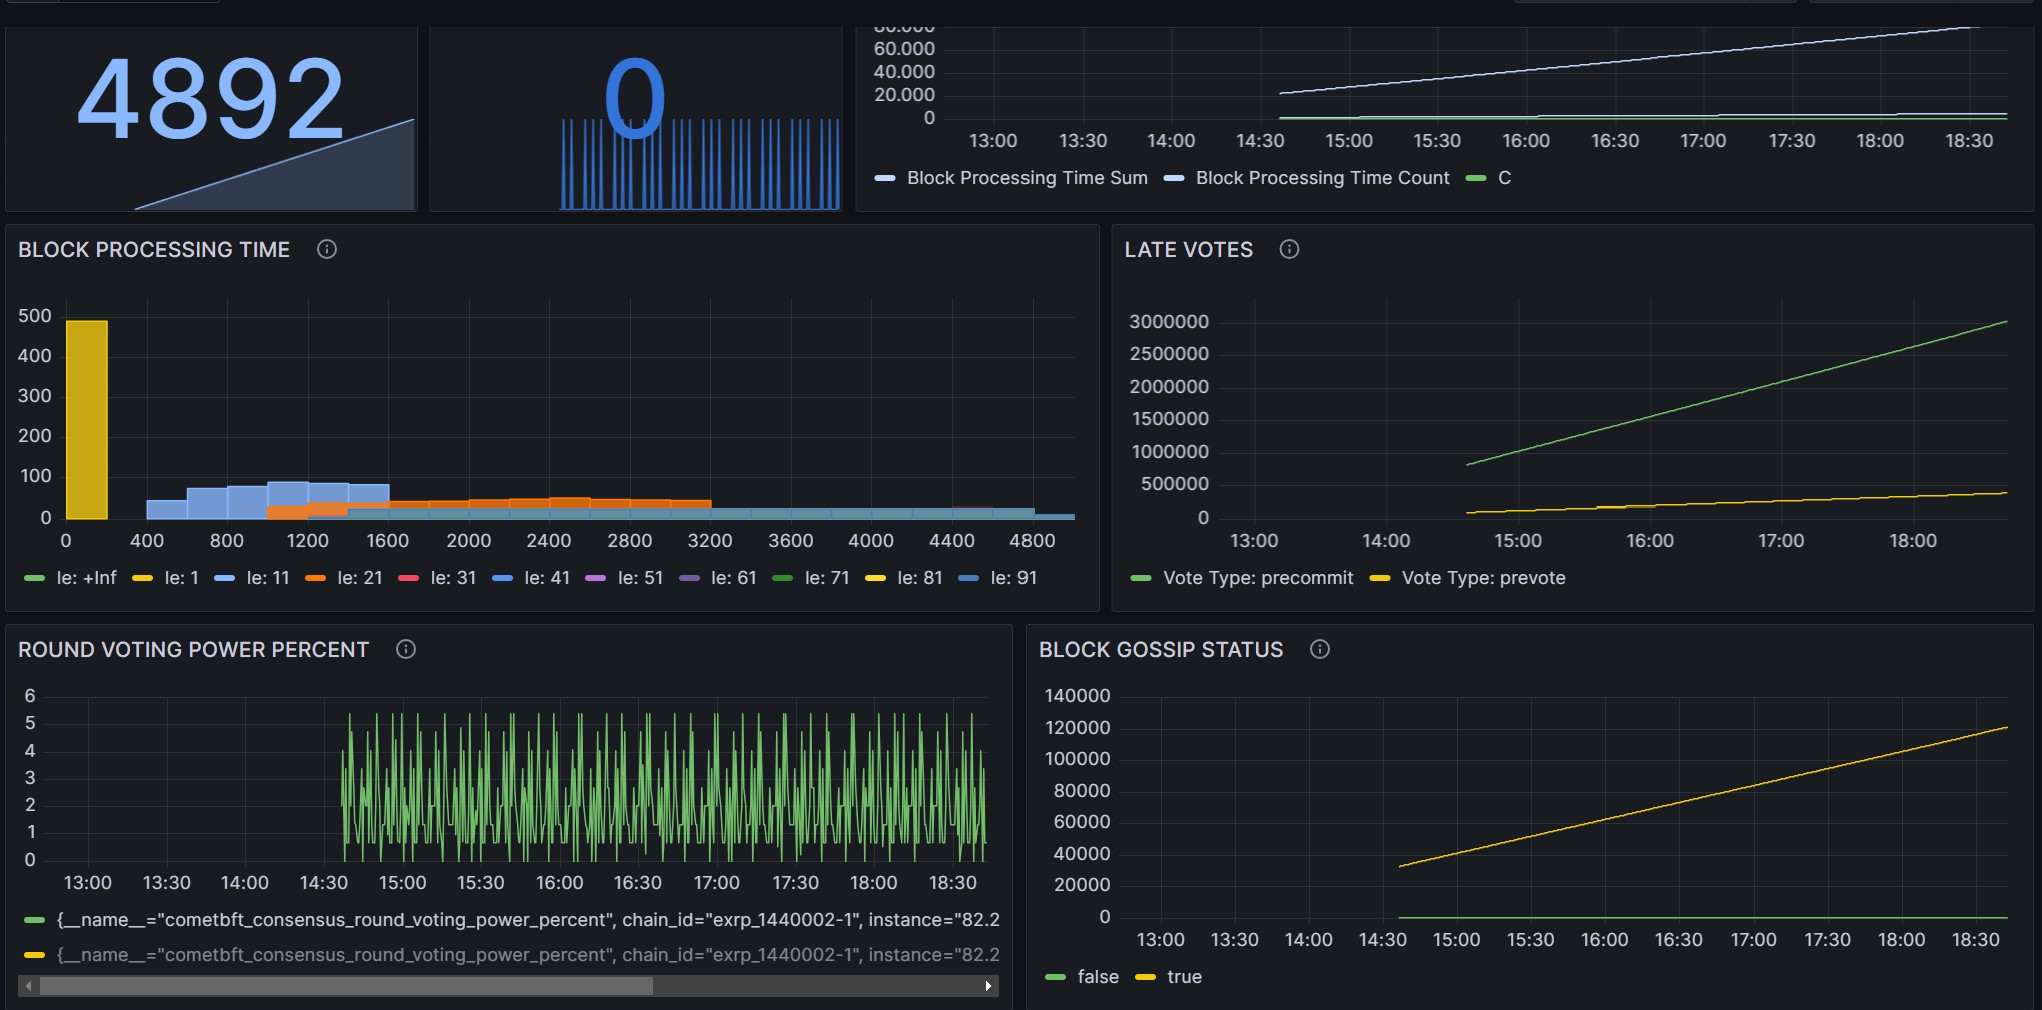
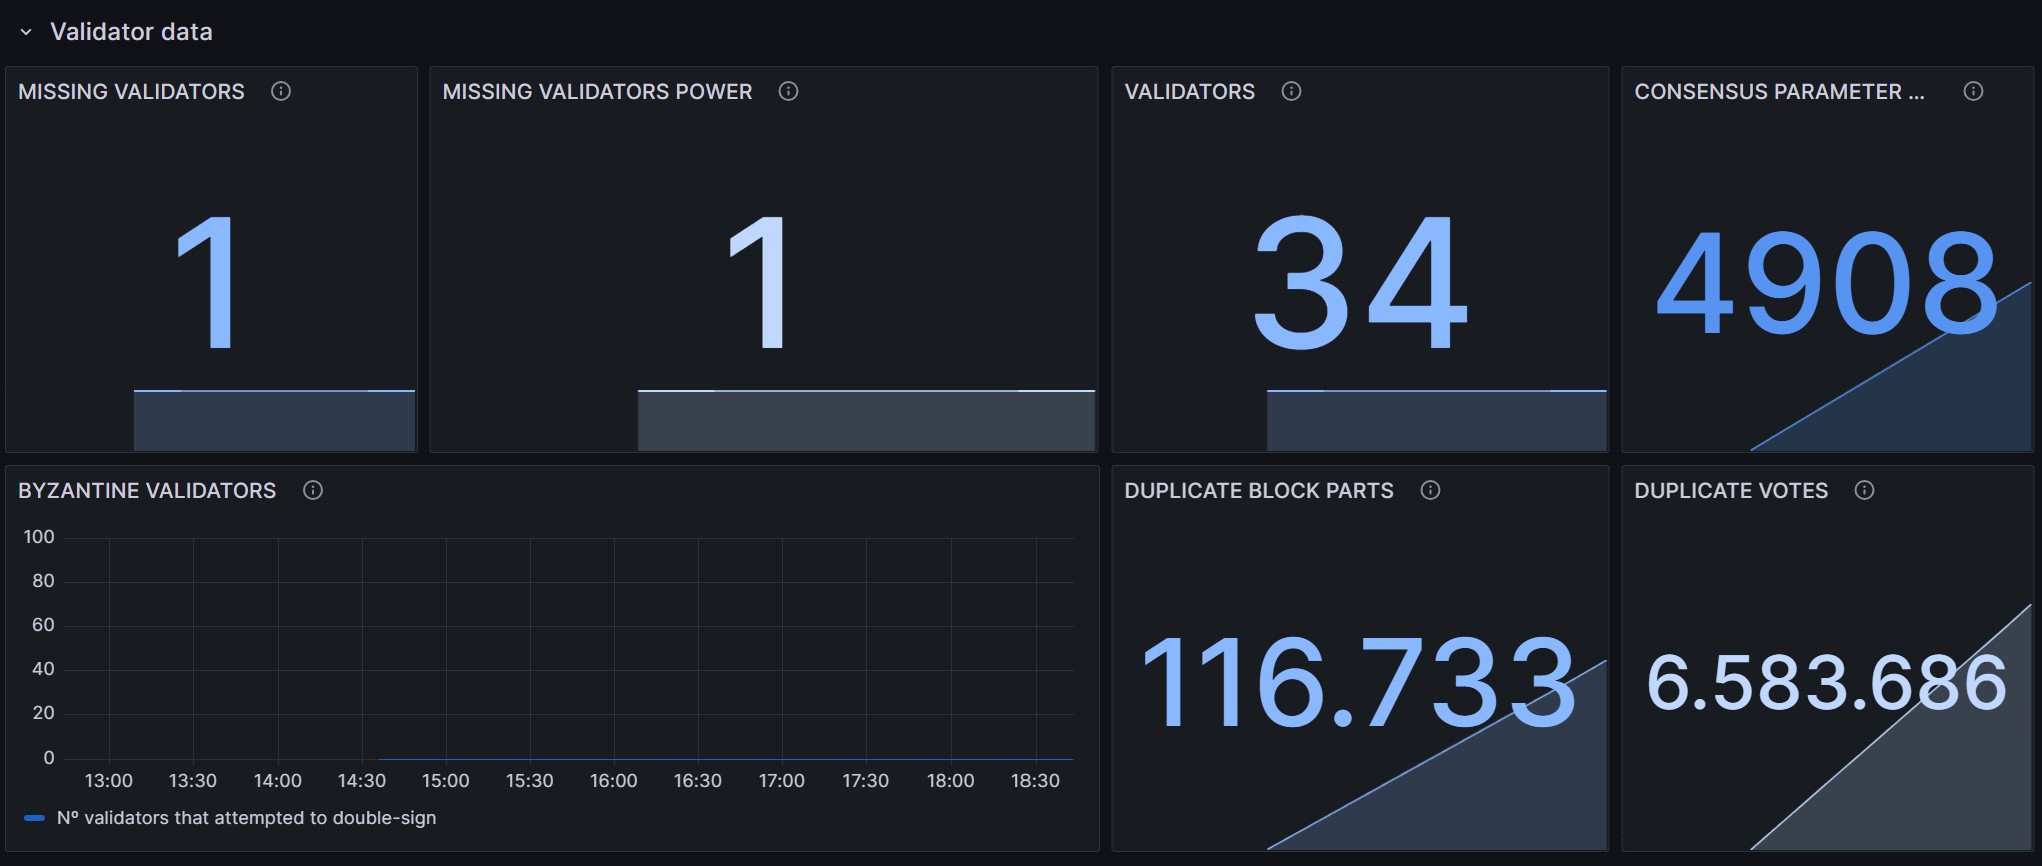
This version of the Grafana dashboard is specifically designed for monitoring XRPL nodes on the mainnet. It includes comprehensive configurations and visualizations tailored to provide real-time insights into the performance and health of your XRPL node. By integrating Grafana with Prometheus and Node Exporter, this setup enables you to track critical metrics, such as consensus participation, validator performance, transaction throughput, and system resource usage, through interactive panels and informative graphs. With this custom monitoring solution, managing and optimizing your XRPL mainnet nodes becomes seamless and efficient, ensuring network stability and optimal performance.
Data source config
Collector config:
Upload an updated version of an exported dashboard.json file from Grafana
| Revision | Description | Created | |
|---|---|---|---|
| Download |