Node Status
Awesome dashboard for quick diagnostics of nodes in a Kubernetes cluster
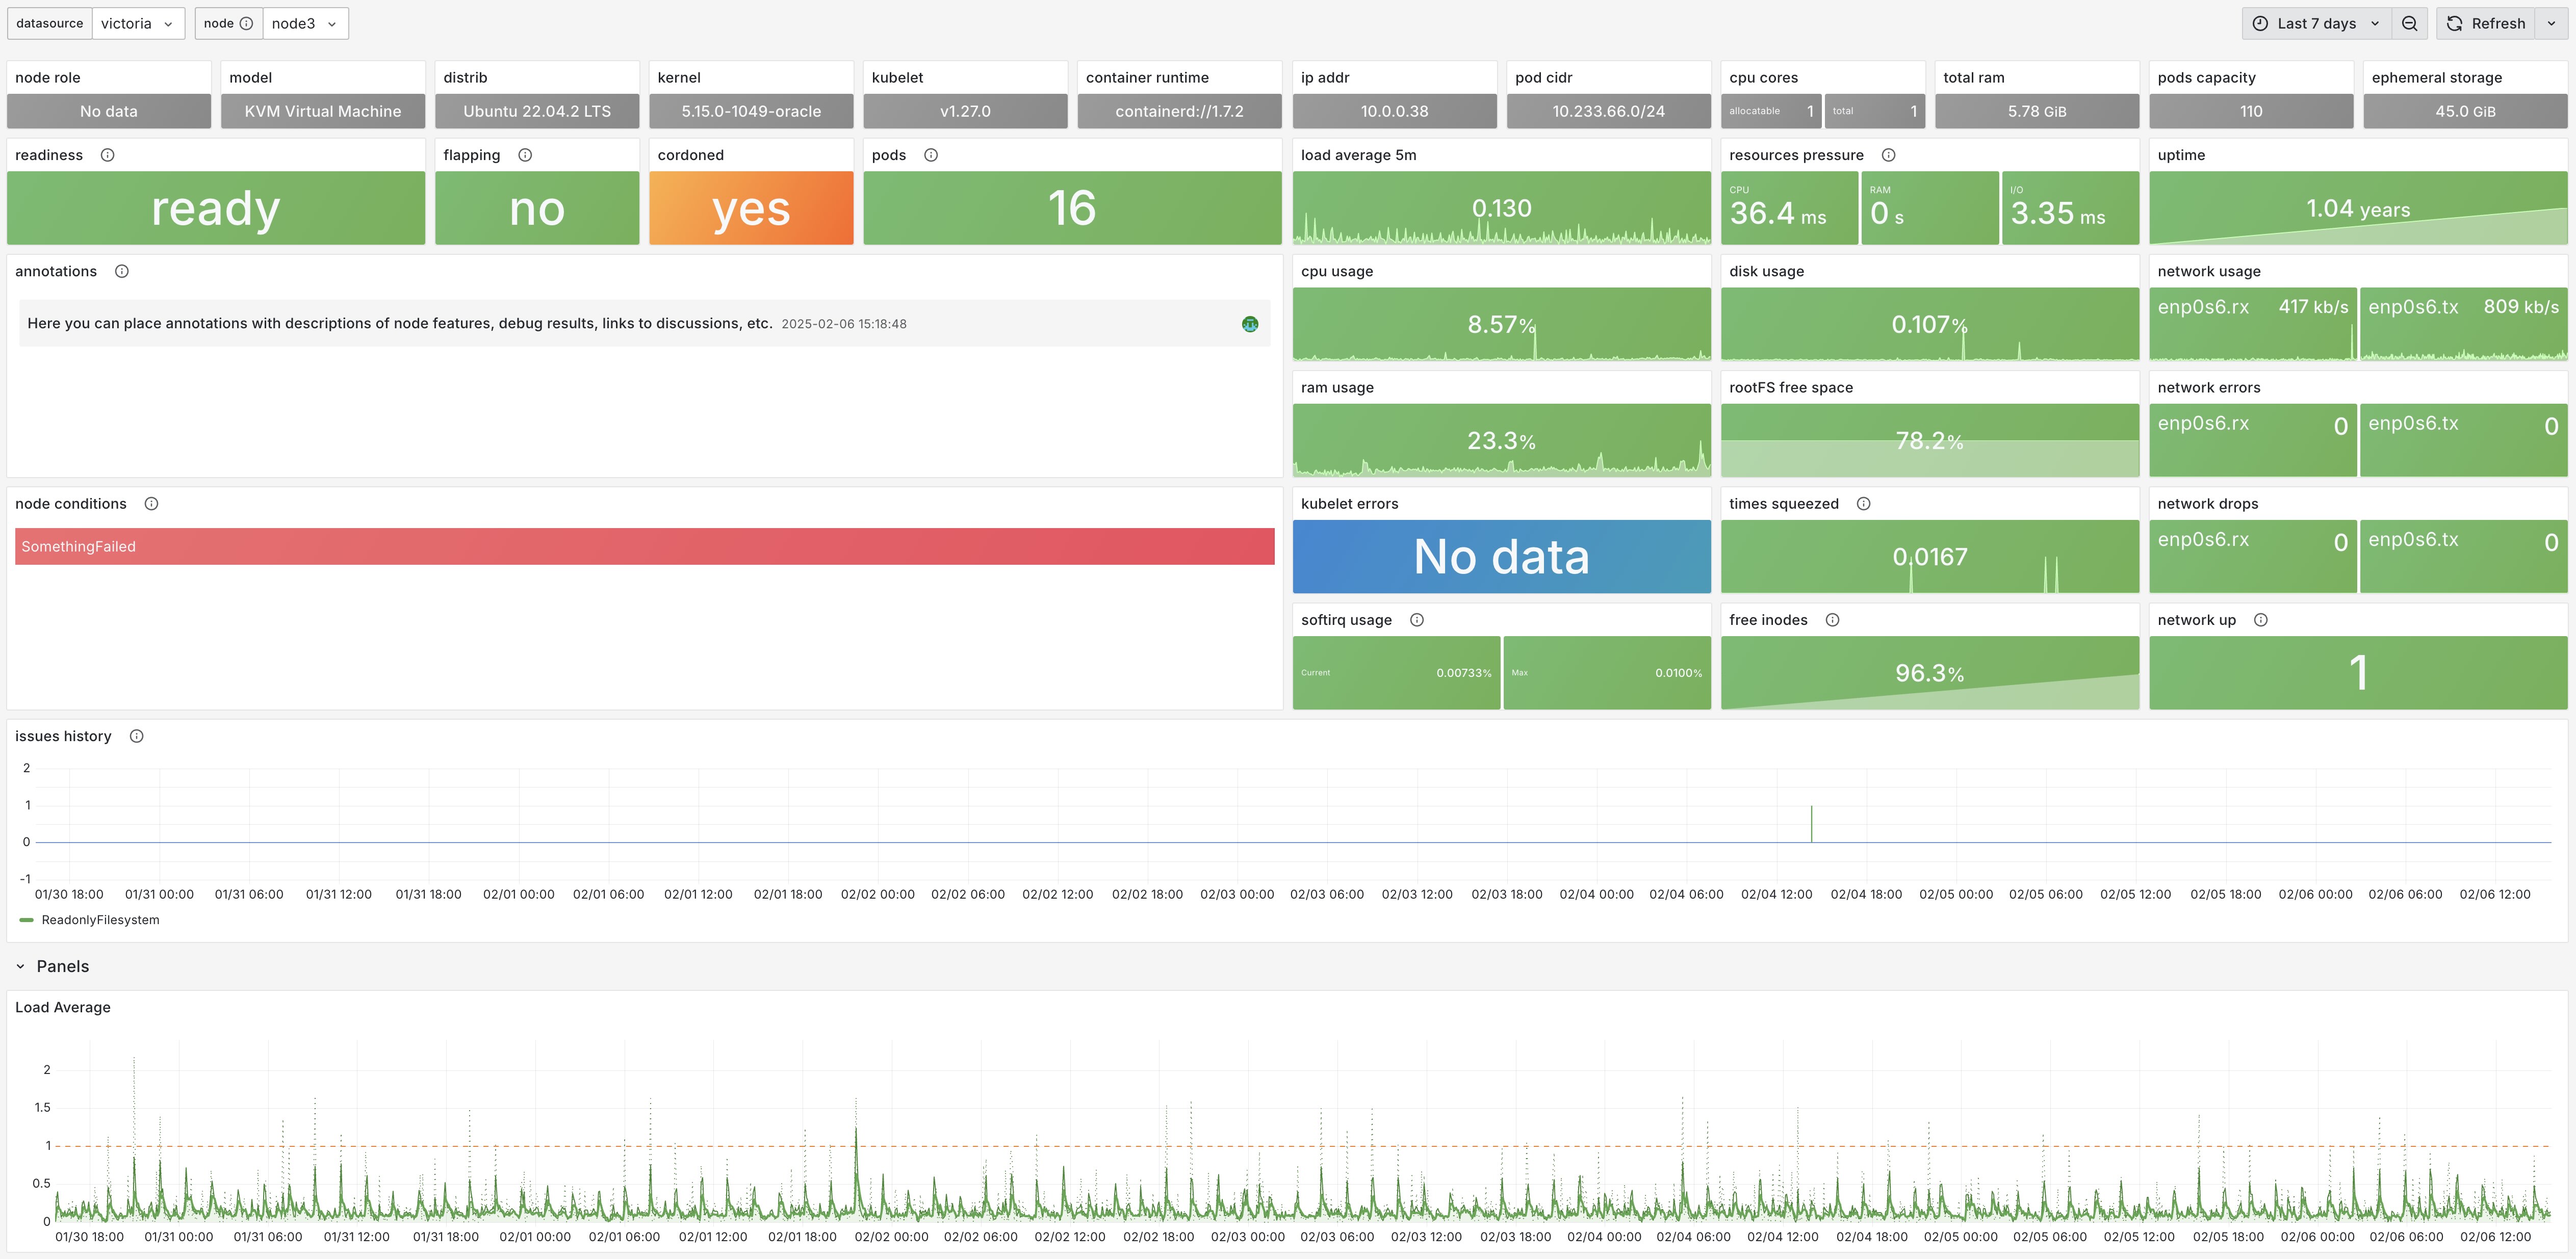
Node Status is designed for quick diagnostics of a node in a Kubernetes cluster. It compactly displays all the main information about it. Clicking on the small panels opens detailed information on the relevant topic.
Prerequisites
Node Status uses metrics from three sources:
Main approaches
The following approaches were used when designing this dashboard:
- the main information is presented as compactly as possible
- extended information is one click away
- uniform automatic highlighting of panels: orange means "pay attention", red - something is wrong
Data source config
Collector type:
Collector plugins:
Collector config:
Revisions
Upload an updated version of an exported dashboard.json file from Grafana
| Revision | Description | Created | |
|---|---|---|---|
| Download |
Linux Server
Monitor Linux with Grafana. Easily monitor your Linux deployment with Grafana Cloud's out-of-the-box monitoring solution.
Learn more