iLO SNMP Dashboard
Essential Dashboard for iLO health. Works with Prometheus and SNMP Exporter. Check the general status, BIOS, batteries, CPU, RAID, disks, power supply, watts used and memory
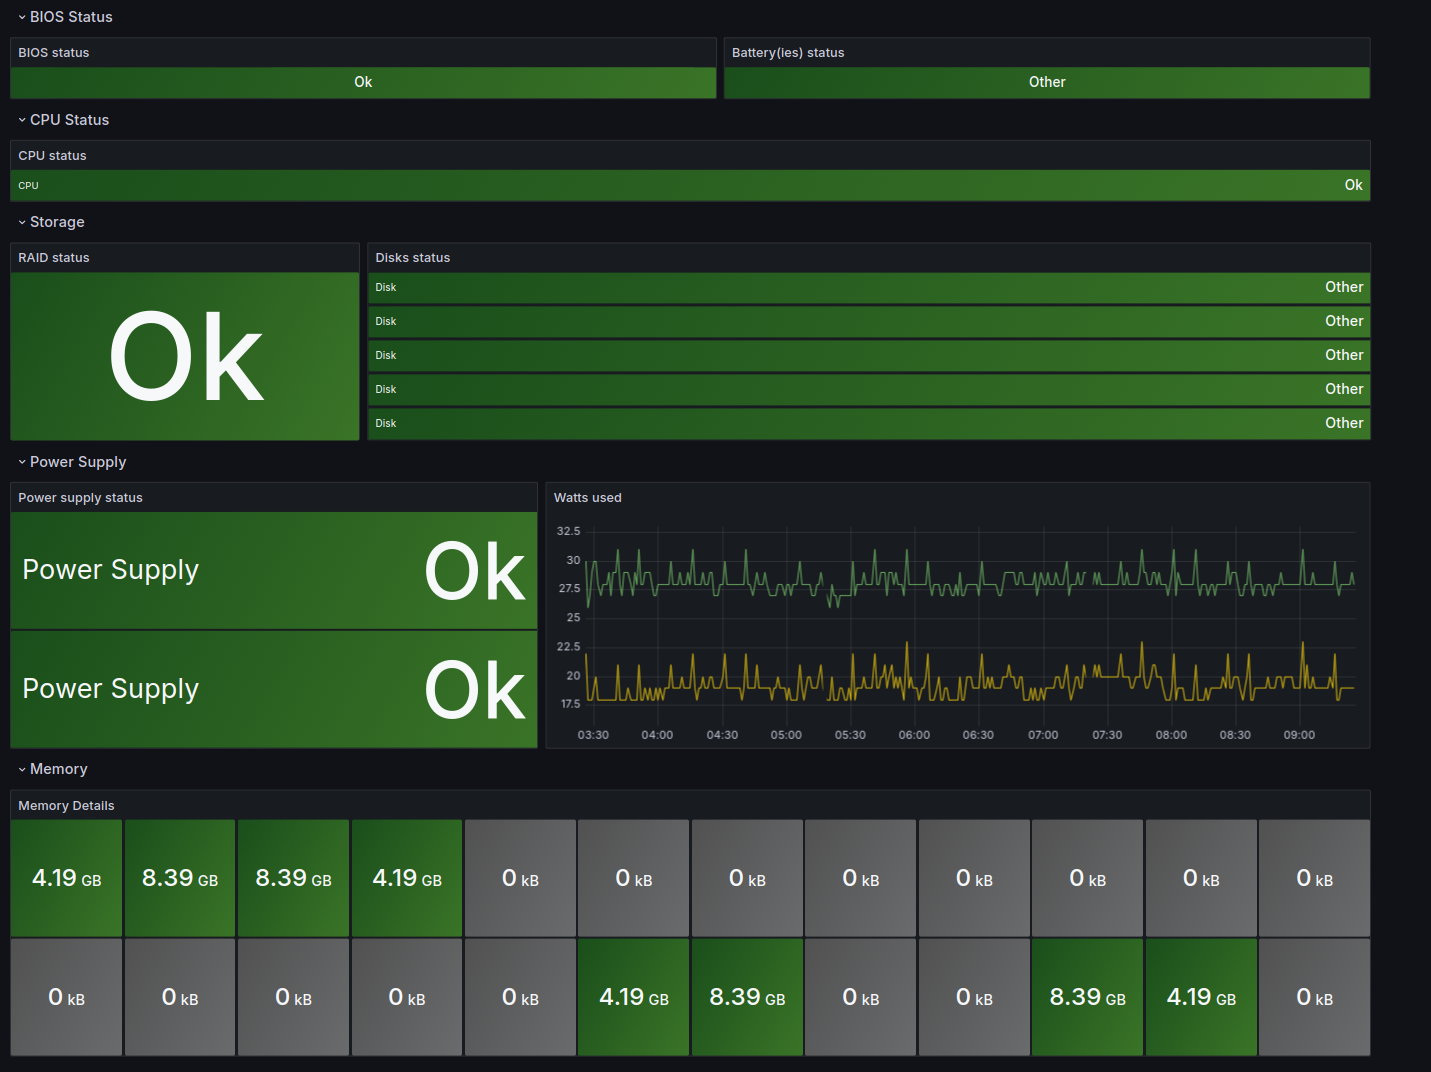
The iLO SNMP Dashboard dashboard uses the prometheus data source to create a Grafana dashboard with the stat and timeseries panels.
Data source config
Collector type:
Collector plugins:
Collector config:
Revisions
Upload an updated version of an exported dashboard.json file from Grafana
| Revision | Description | Created | |
|---|---|---|---|
| Download |
SNMP
Easily monitor any generic SNMP (Simple Network Management Protocol) device with Grafana Cloud's out-of-the-box monitoring solution.
Learn more