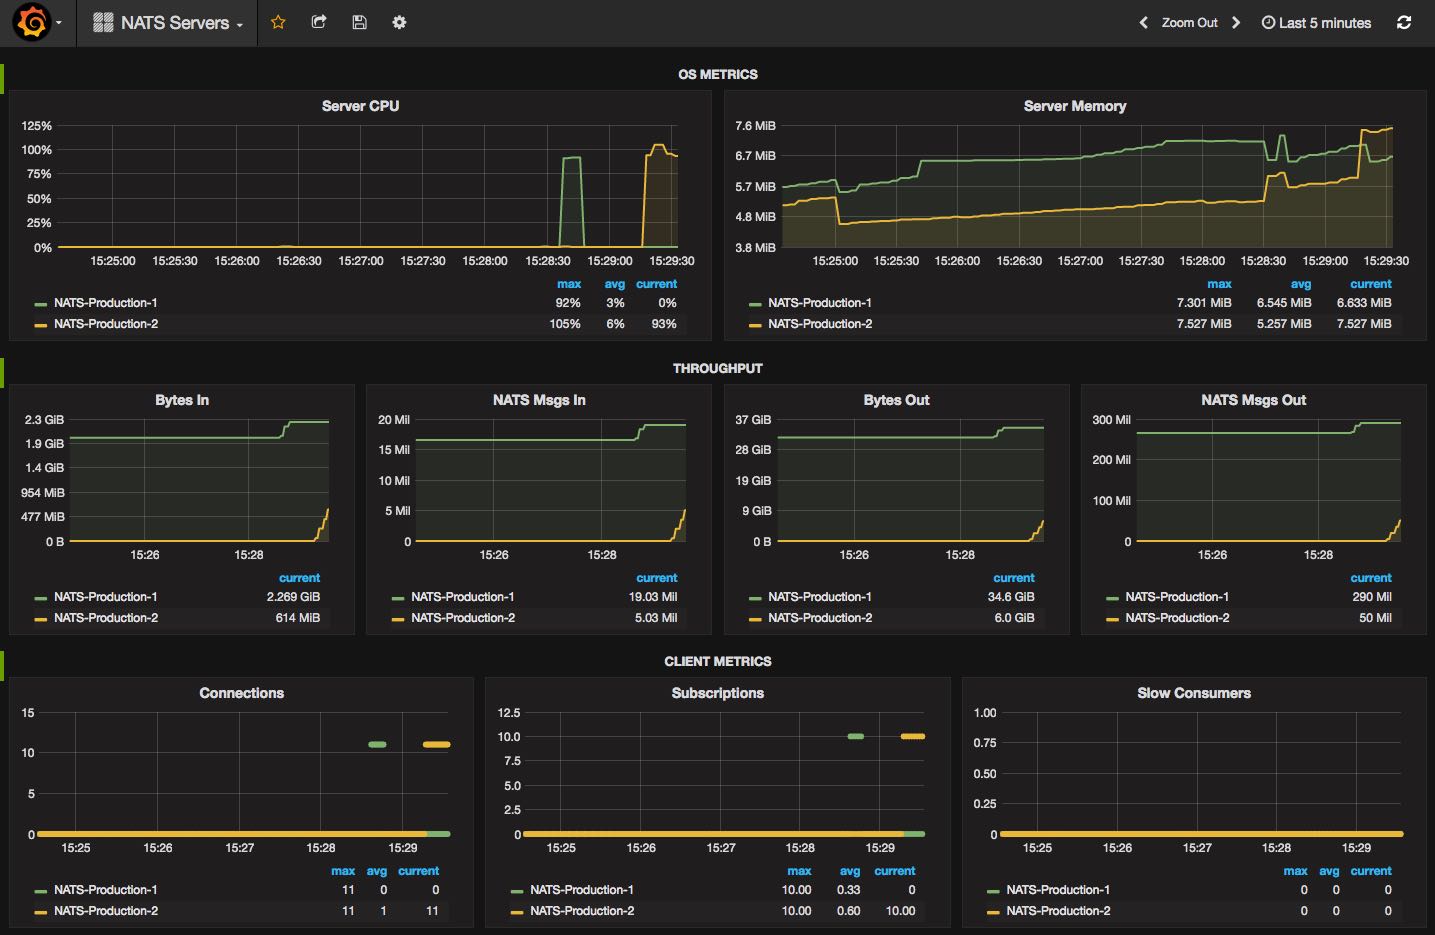
NATS Server Dashboard
NATS Server Dashboard for use with the Prometheus NATS Exporter
The NATS Server Dashboard
NATS acts as a central nervous system for distributed systems at scale, such as mobile devices, IoT networks, and cloud native infrastructure. This is a dashboard for use with the Prometheus NATS Exporter, which provides NATS server metrics through Prometheus.
Metrics such as CPU utilization, memory usage, throughput, connection counts, and subscription counts are displayed. Multiple NATS servers can be monitored in the same dashboard to provide a complete view of your NATS server cluster.
This is also a great start to develop your own custom NATS dashboard.
Walkthrough
A walkthrough setting up Grafana, NATS, and Prometheus can be found here.
Issues and Suggestions
Please report any issues, suggestions, or feature requests through github, by creating an issue here.
More Information
Visit http://nats.io for additional information.
Data source config
Collector config:
Upload an updated version of an exported dashboard.json file from Grafana
| Revision | Description | Created | |
|---|---|---|---|
| Download |
