Grafana Operator
Grafana Operator Dashboard.
Grafana Operator Monitoring Dashboard
This dashboard provides a comprehensive overview of the Grafana Operator’s health and the status of its managed resources across multiple Kubernetes clusters. It offers detailed insights into resource utilization, API request rates, and work queue performance. The dashboard integrates with Prometheus and kube-state-metrics, enabling efficient monitoring and issue detection in Grafana Operator deployments.
Key Features
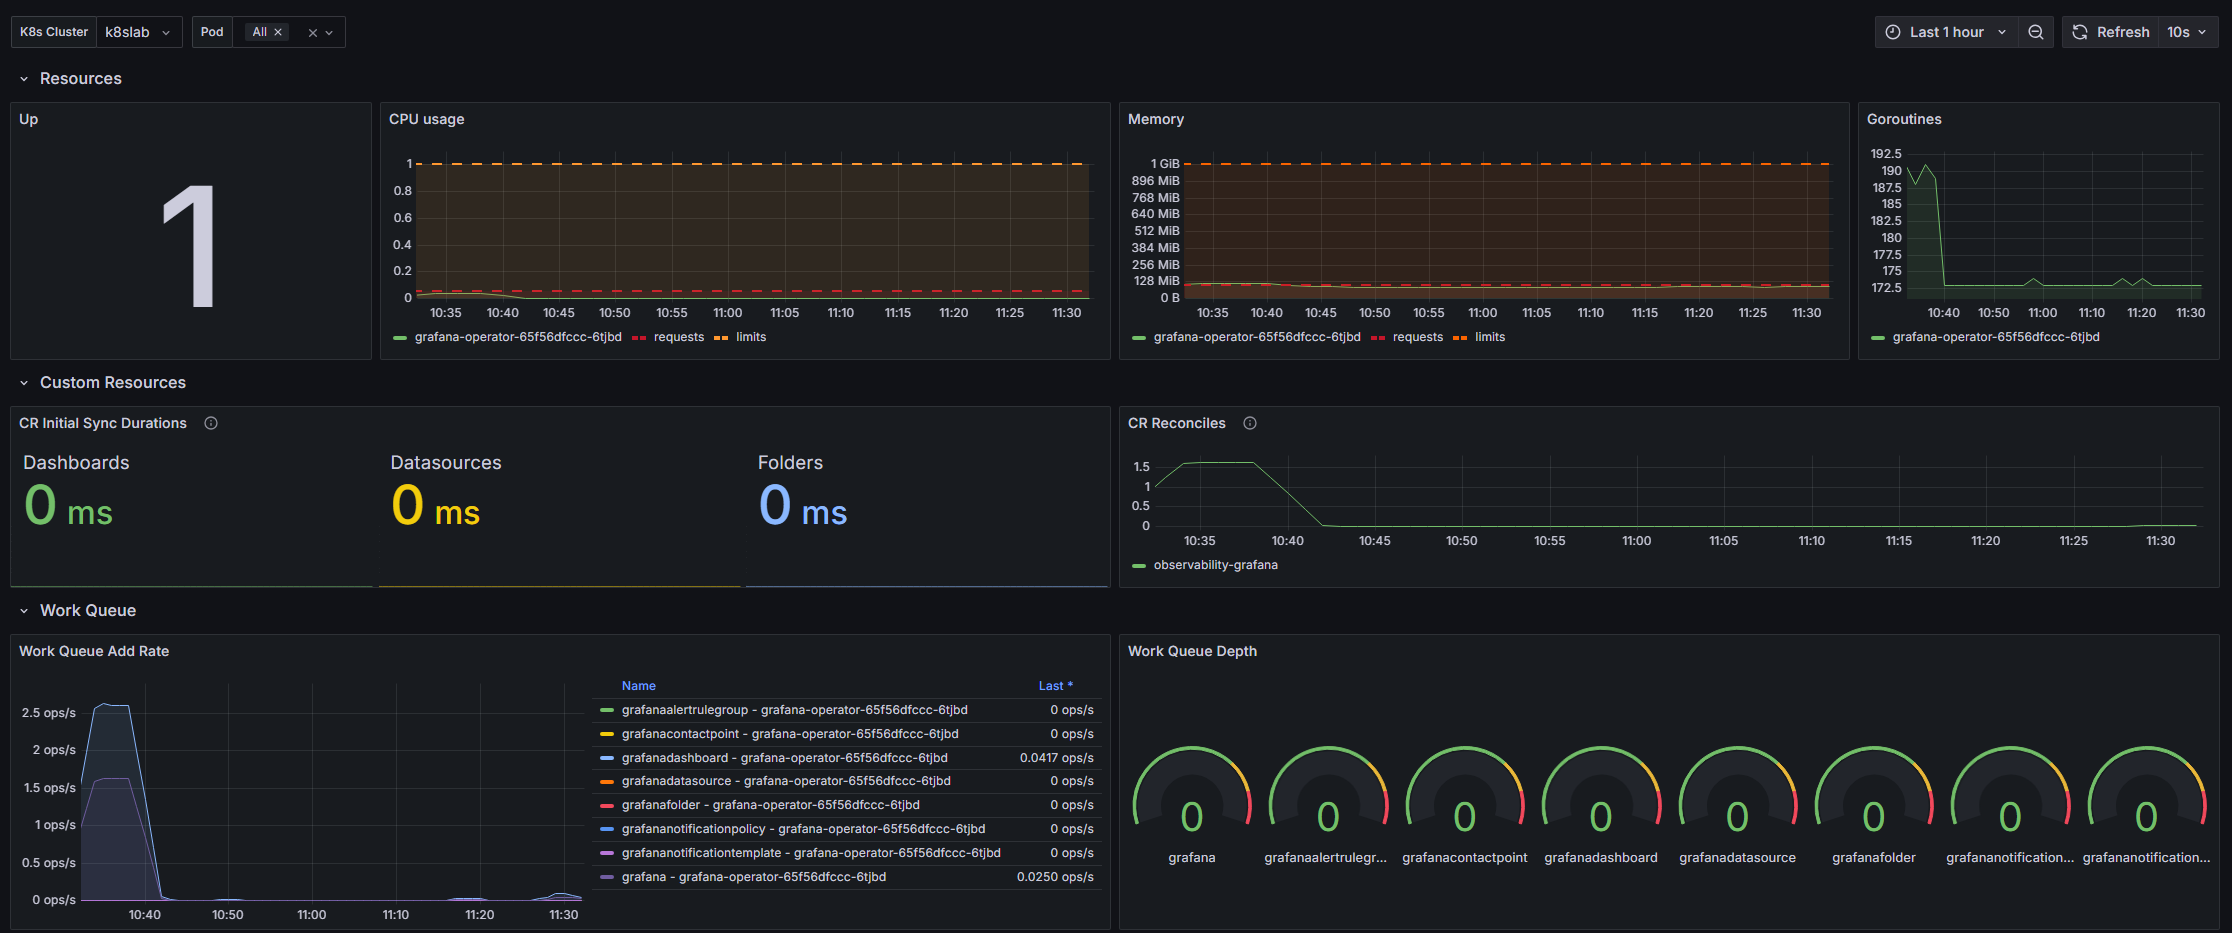
1. Cluster & Pod Overview
- Up Status: Displays the status of the Grafana Operator across all selected clusters and pods.
- Goroutines: Monitors the number of active goroutines for the Grafana Operator, helping identify potential issues with concurrency or resource exhaustion.
2. Resource Usage
Kube-State-Metrics are used for these panels
- CPU Usage: Visualizes the CPU consumption of Grafana Operator pods, along with requested and limit values for better capacity planning.
- Memory Usage: Tracks memory usage for each pod, showing requests and limits to identify potential memory saturation.
3. Custom Resource Metrics
- CR Initial Sync Durations: Measures the time taken to synchronize custom resources like dashboards and datasources after a Grafana Operator restart.
- CR Reconciles: Tracks reconciliation rates for custom resources per Grafana instance to monitor operational health.
4. Work Queue Insights
- Work Queue Add Rate: Shows the rate at which tasks are added to the Grafana Operator’s work queue, indicating operational load.
- Work Queue Depth: Displays the number of tasks waiting in the work queue, helping identify potential bottlenecks.
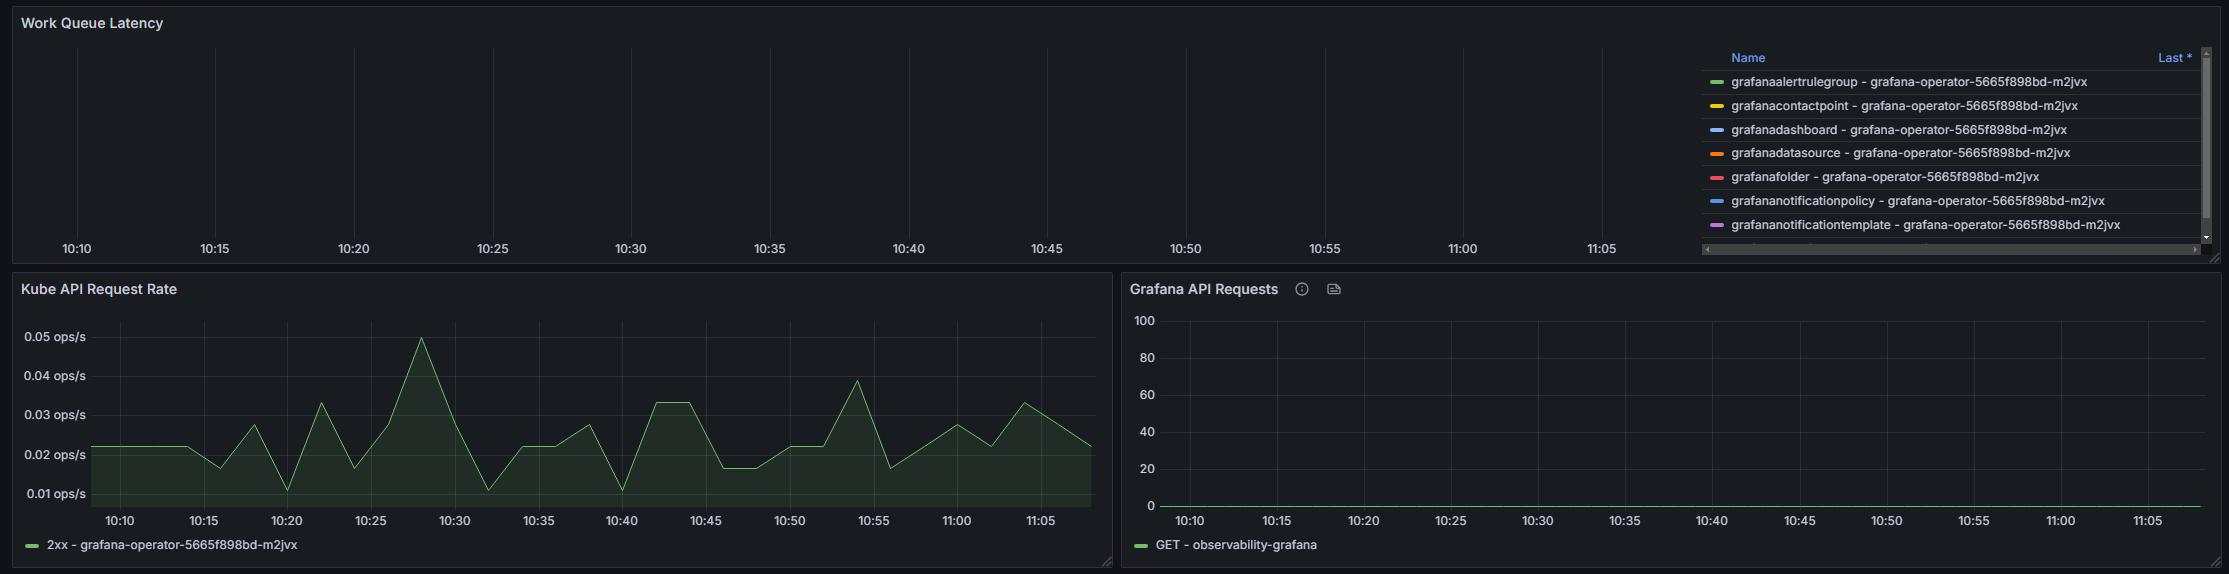
- Work Queue Latency: Measures task processing latency using histogram quantiles to detect delays.
5. Kube API & Grafana API Metrics
- Kube API Request Rate: Monitors the rate of Kubernetes API requests categorized by response codes (2xx, 3xx, 4xx, 5xx) to identify potential API issues.
- Grafana API Requests: Tracks the number of requests made to the Grafana API, grouped by method and instance for granular monitoring.
Customization Options
- K8s Cluster Variable: Allows switching between different Kubernetes clusters for multi-cluster monitoring.
- The Kubernetes cluster name is fetched from the
up{job="apiserver}expression result. By default theclusterlabel key is used, but the key where we are fetching this value from, can be customized using thek8sClusterLabelKeyvariable.
- The Kubernetes cluster name is fetched from the
- Pod Selection: Supports filtering metrics by specific pods to focus on individual resources.
- kube-state-metrics Job: Enables customization of the kube-state-metrics job used for collecting resource metrics, through the
kubeStateMetricsJobvariable.
Data source config
Collector type:
Collector plugins:
Collector config:
Revisions
Upload an updated version of an exported dashboard.json file from Grafana
| Revision | Description | Created | |
|---|---|---|---|
| Download |