Lightweight APM for OpenTelemetry
Lightweight APM dashboard for monitoring OpenTelemetry-based services. Instrument your applications using OpenTelemetry SDKs and send traces, metrics, and logs to Tempo for traces, a Prometheus-compatible database like Mimir for metrics, and Loki for logs. This dashboard provides a centralized view of your application's health and performance. For a fully managed observability stack, consider using Grafana Cloud. Learn more about this dashboard on https://github.com/cyrille-leclerc/opentelemetry-service-dashboard.
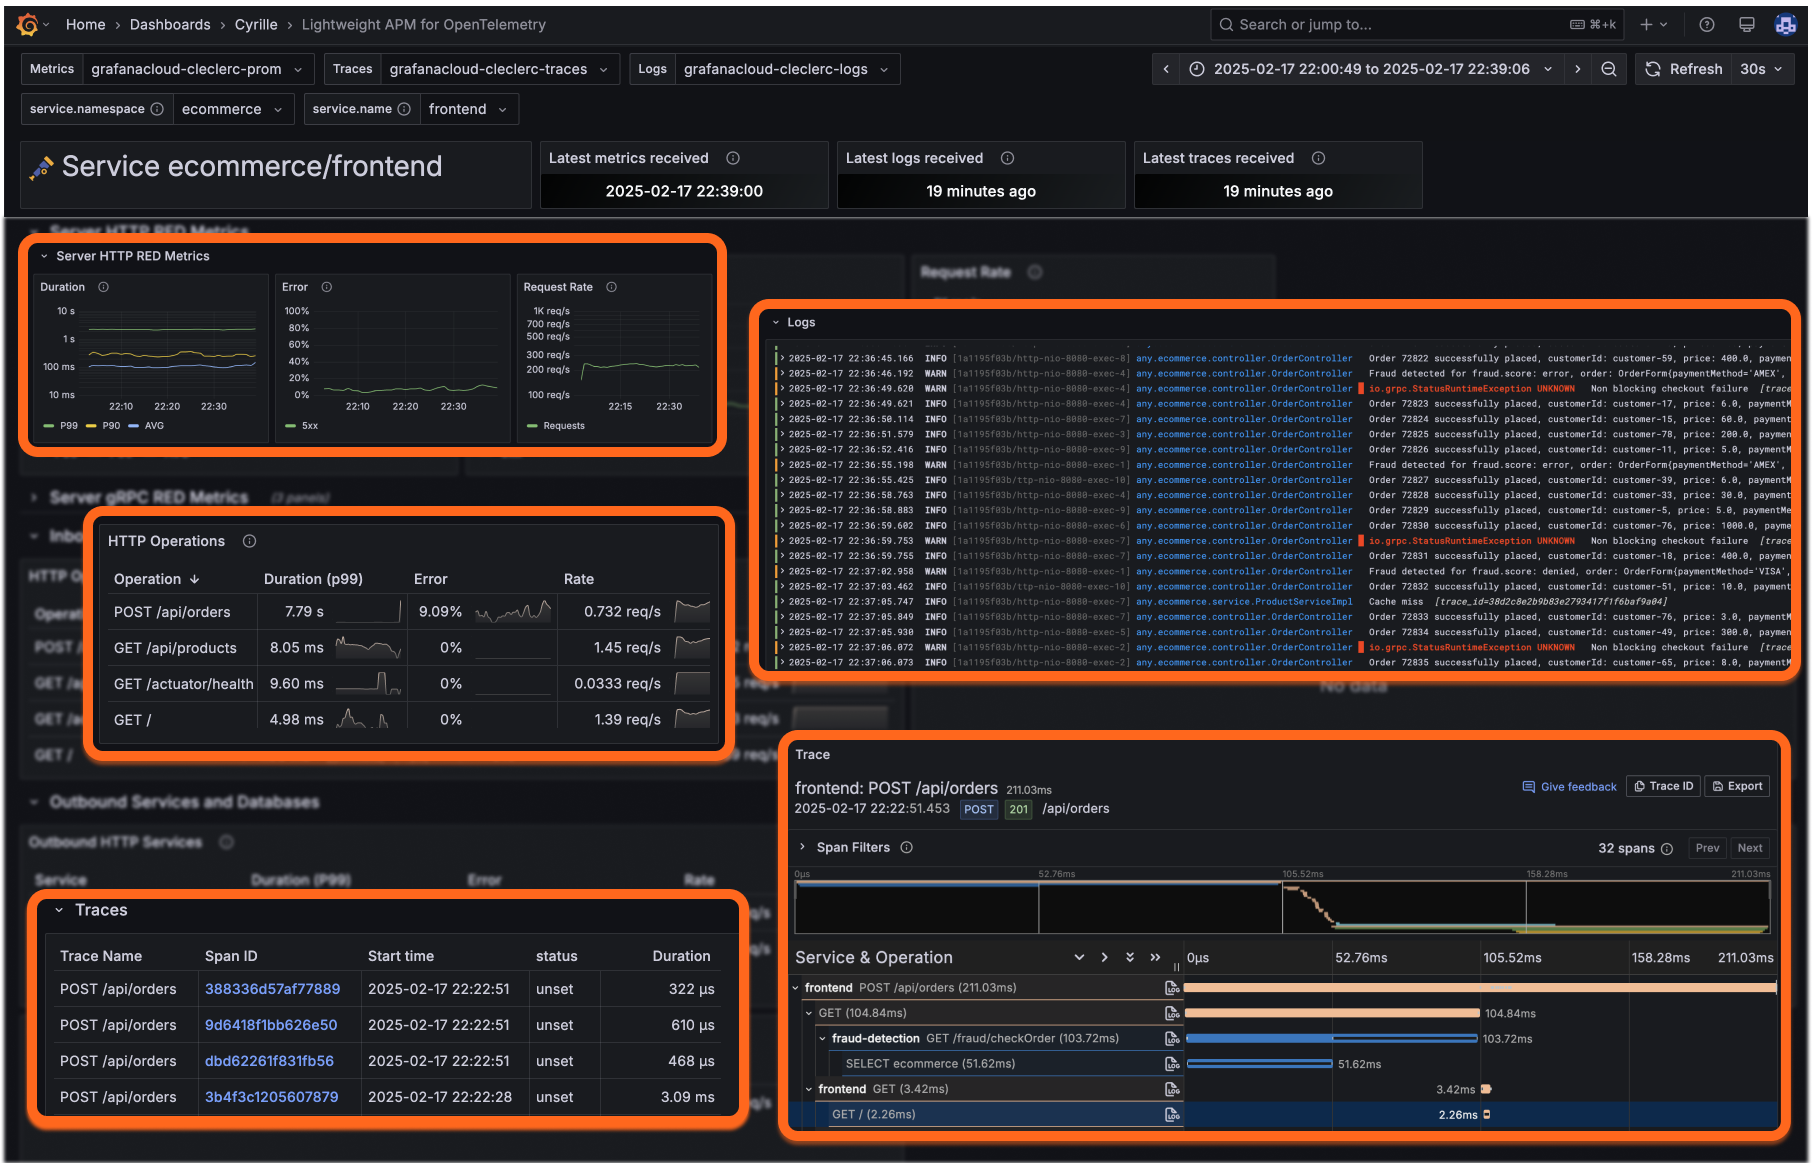
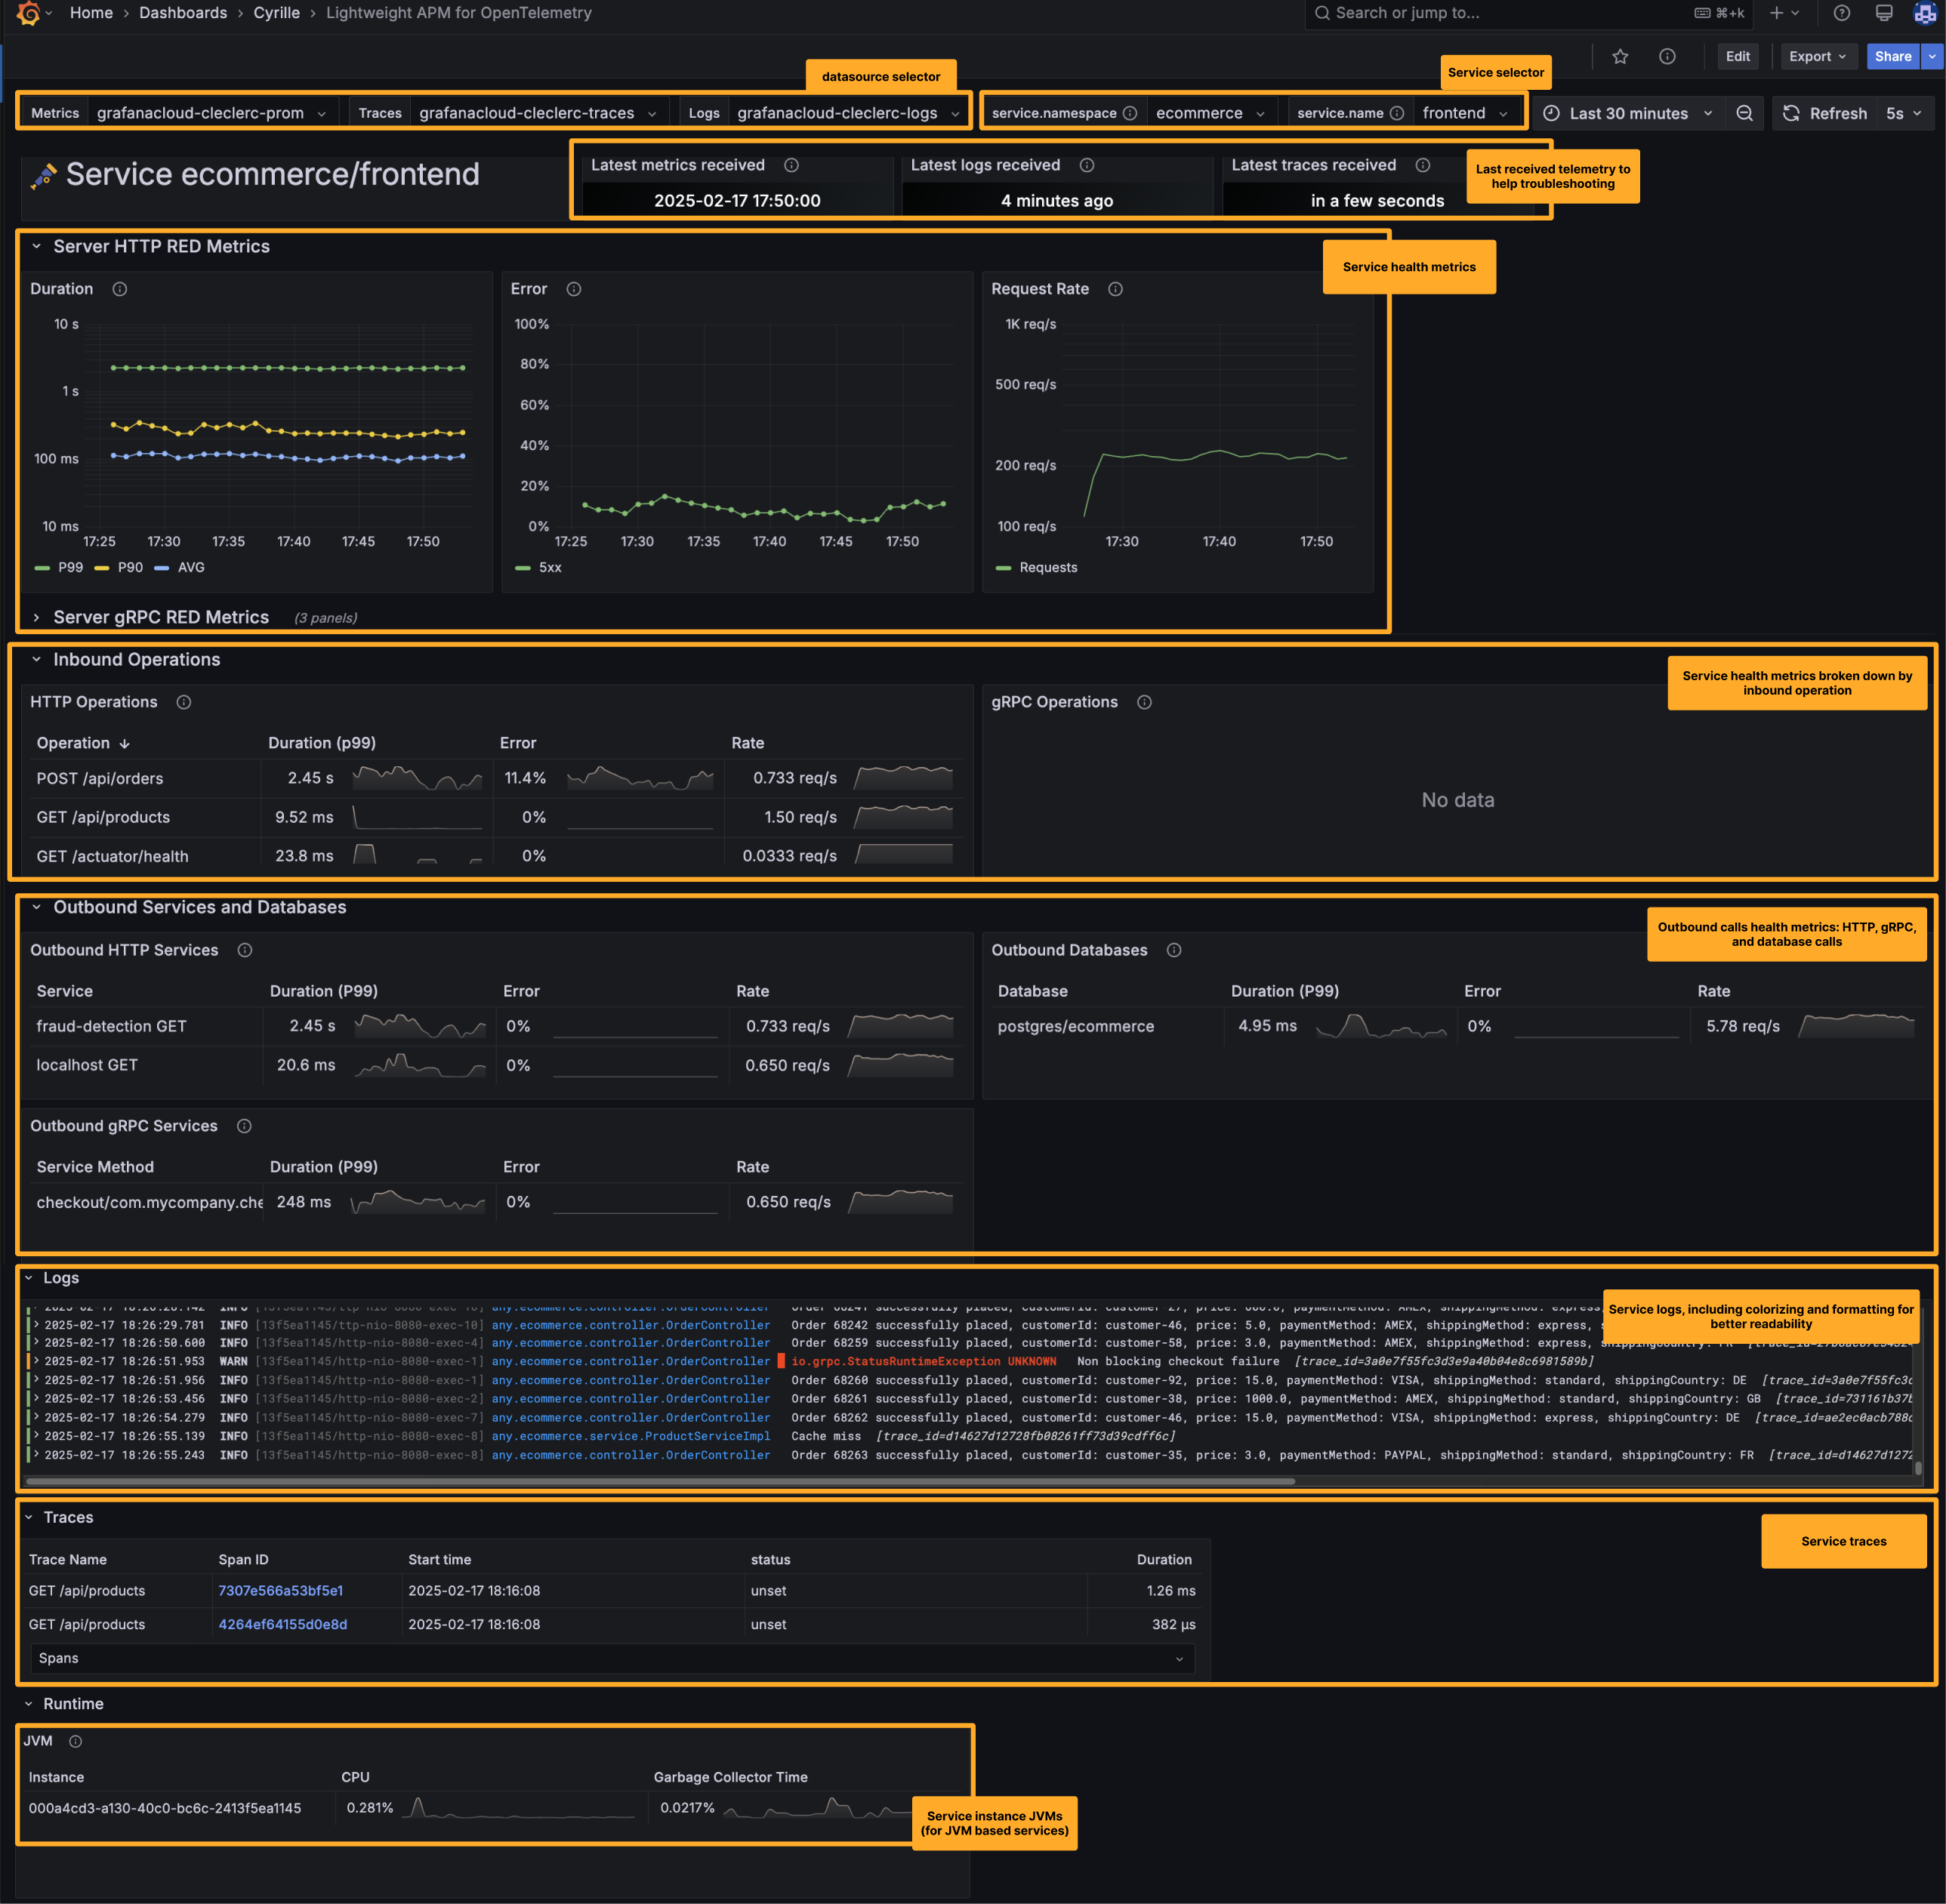
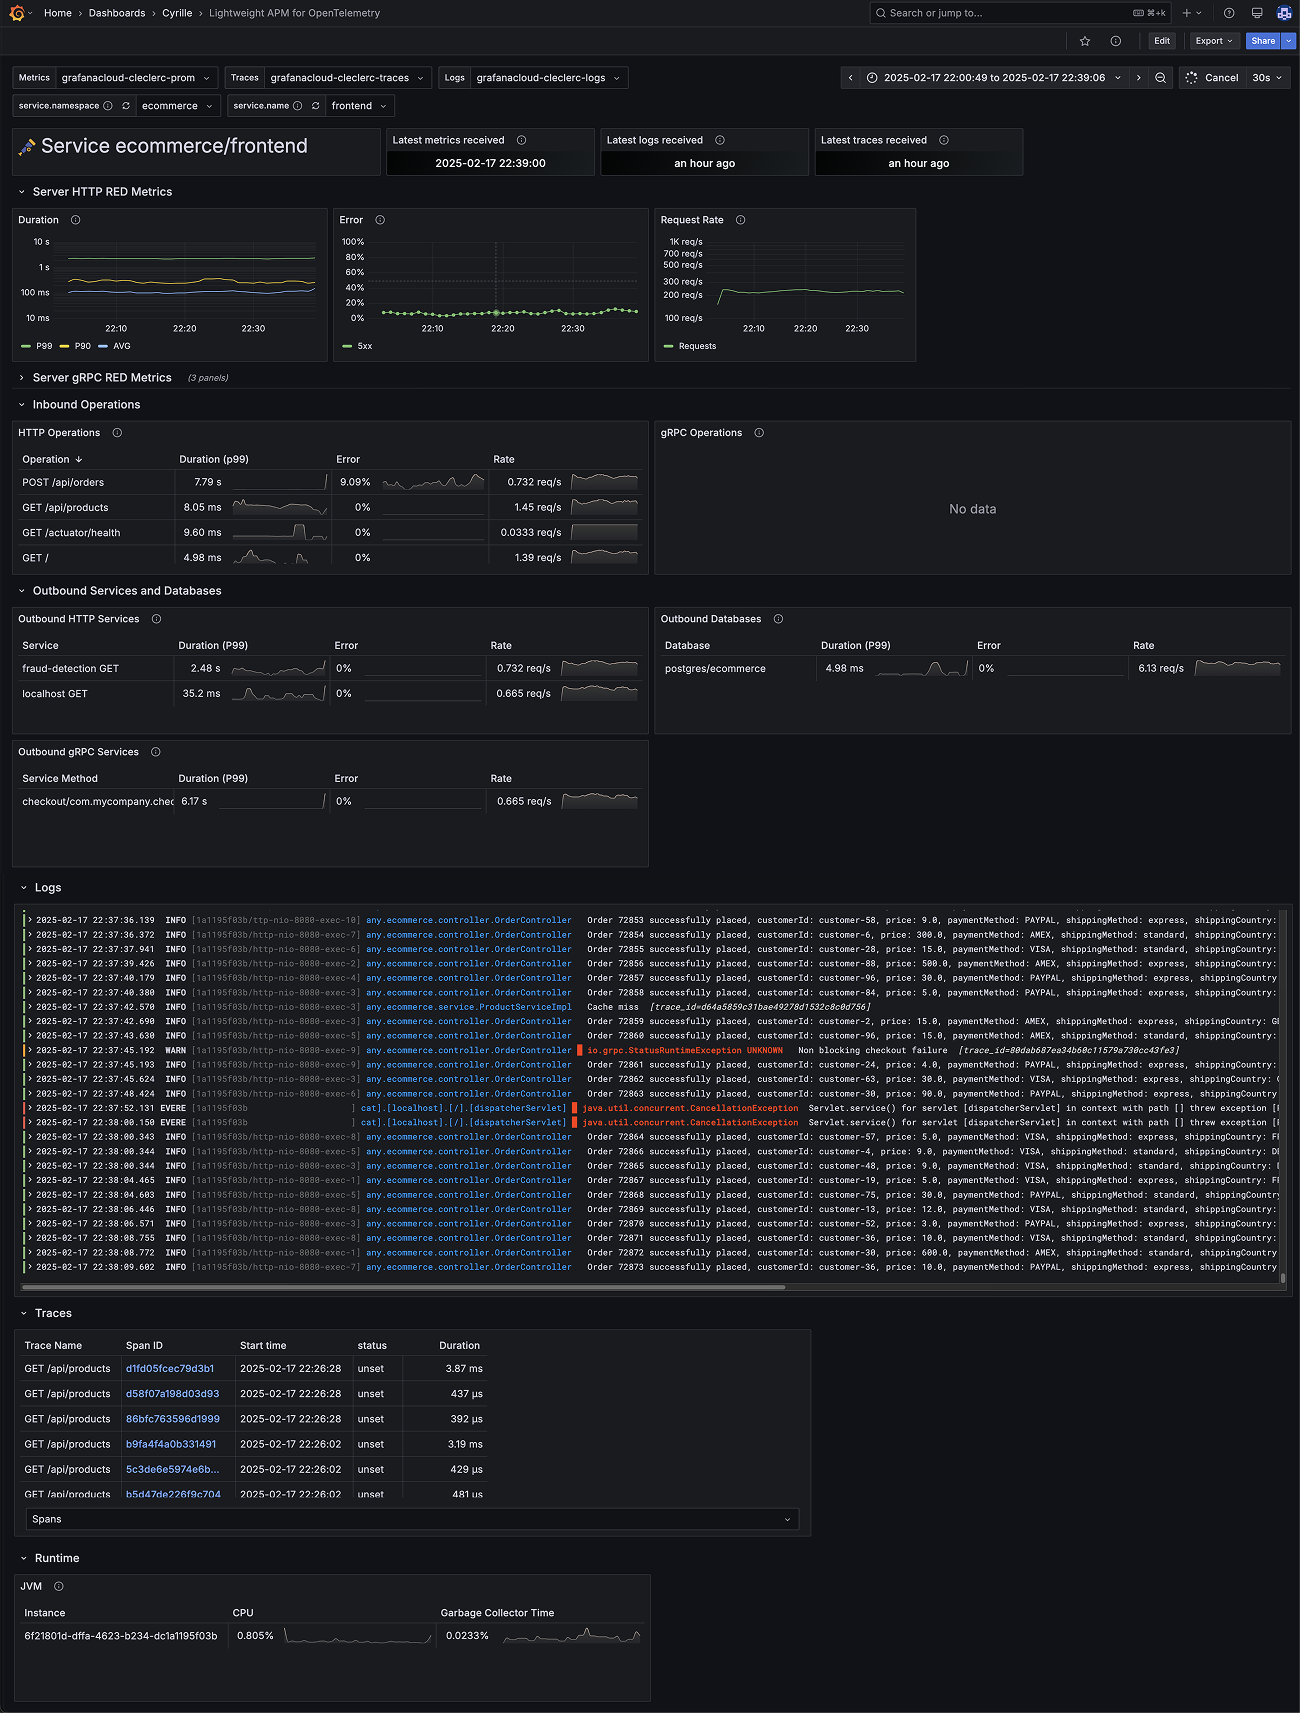
Lightweight APM for OpenTelemetry
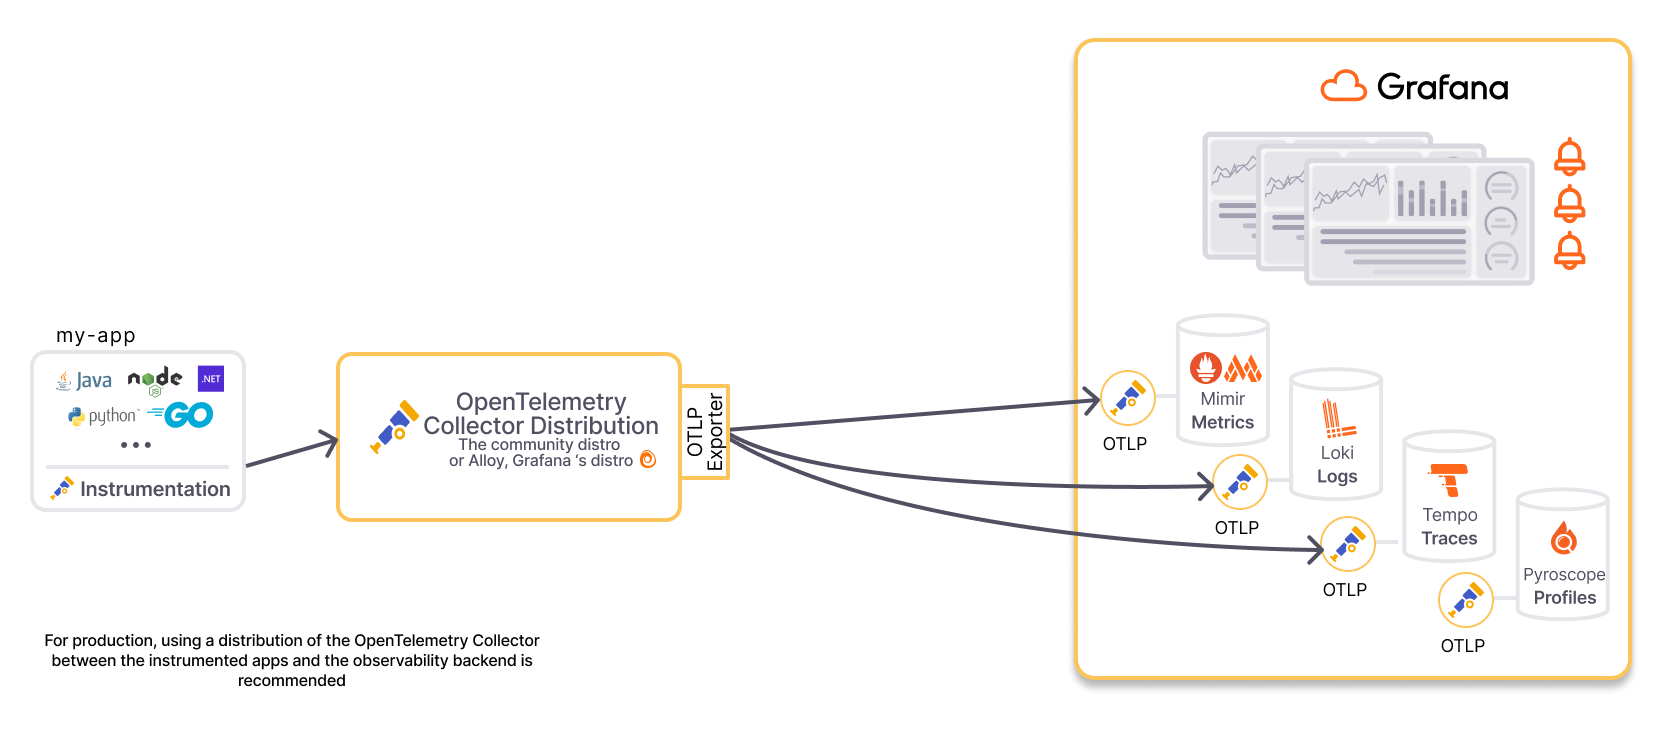
Instrument your applications using OpenTelemetry SDKs and send traces, metrics, and logs to Tempo for traces, a Prometheus-compatible database like Mimir for metrics, and Loki for logs. This dashboard provides a centralized view of your application's health and performance.
For a fully managed observability stack, consider using Grafana Cloud.
Learn more about this dashboard here.
Setup
- IMPORTANT Configure a Prometheus database like Grafana Mimir enabling resource attribute promotion (see database configuration below)
- Instrument services with OpenTelemetry SDK libraries and auto-instrumentation agents. Ensure the instrumentation produces:
- Metrics: HTTP metrics, gRPC metrics, or Database Client Metrics
- Traces: optional
- Logs: optional
- Send generated telemetry (details in FAQ below):
- Traces to Grafana Tempo
- Metrics to a Prometheus database like Grafana Mimir using its OTLP endpoint.** Stop converting metrics from OTel to Prometheus using the OpenTelemetry Collector Prometheus Remote Write Exporter, send OTLP to the Prometheus database.**
- Logs to Grafana Loki using the Loki OTLP/HTTP endpoint
- Ensure that a datasource is setup in Grafana for each of these Tempo, Prometheus, and Loki databases
- In Grafana, create the "OpenTelemetry Service" dashboard:
- Navigate to "Dashboards" then click on the "New / New dashboard" button
- Click on "Import a dashboard"
- On the "Import dashboard" screen, enter the ID
22784then click on the "Load" button
Database configuration
Prometheus OTLP Endpoint configuration
Example Prometheus OTLP Endpoint configuration
otlp:
  keep_identifying_resource_attributes: true
  promote_resource_attributes:
    # REQUIRED FOR THIS DASHBOARD
    - service.instance.id
    - service.name
    - service.namespace
    - deployment.environment.name
    # RECOMMENDED FOR OTEL METRICS IN GENERAL
    - service.version
    - cloud.availability_zone
    - cloud.region
    - container.name
    - deployment.environment
    - k8s.cluster.name
    - k8s.container.name
    - k8s.cronjob.name
    - k8s.daemonset.name
    - k8s.deployment.name
    - k8s.job.name
    - k8s.namespace.name
    - k8s.pod.name
    - k8s.replicaset.name
    - k8s.statefulset.name
Learn more in Prometheus configuration reference and OpenTelemetry guide.
Mimir OTLP Endpoint configuration
Configure the parameters otel_keep_identifying_resource_attributes and promote_otel_resource_attributes on the OTLP endpoint.
Example Mimir OTLP Endpoint configuration snippet:
# (experimental) Whether to keep identifying OTel resource attributes in the
# target_info metric on top of converting to job and instance labels.
# CLI flag: -distributor.otel-keep-identifying-resource-attributes
otel_keep_identifying_resource_attributes: true
# (experimental) Optionally specify OTel resource attributes to promote to
# labels.
# CLI flag: -distributor.otel-promote-resource-attributes
promote_otel_resource_attributes: "service.instance.id, service.name, service.namespace, service.version, cloud.availability_zone, cloud.region, container.name, deployment.environment, deployment.environment.name, k8s.cluster.name, k8s.container.name, k8s.cronjob.name, k8s.daemonset.name, k8s.deployment.name, k8s.job.name, k8s.namespace.name, k8s.pod.name, k8s.replicaset.name, k8s.statefulset.name"
Learn more in Mimir configuration parameters.
Grafana Cloud Metrics configuration
Send OpenTelemetry metrics to the Grafana Cloud OTLP Endpoint as documented in Grafana Cloud / Send OTLP data and open a support ticket to activate otel_keep_identifying_resource_attributes.
Note that the Grafana Cloud OTLP Endpoint is configured by default to promote the following resource attributes, this list can be modified through a support ticket. If your Grafana Cloud stack has not been configured, please open a support ticket. Default promoted resource attributes:
- service.instance.id
- service.name
- service.namespace
- deployment.environment.name
- service.version
- cloud.availability_zone
- cloud.region
- container.name
- deployment.environment
- k8s.cluster.name
- k8s.container.name
- k8s.cronjob.name
- k8s.daemonset.name
- k8s.deployment.name
- k8s.job.name
- k8s.namespace.name
- k8s.pod.name
- k8s.replicaset.name
- k8s.statefulset.name
FAQ
What are the compatible OpenTelemetry SDKs and auto-instrumentations
Dashboard mostly tested with the OpenTelemetry Instrumentation for Java, compatible with instrumentation that produce OpenTelemetry compliant traces, logs, HTTP metrics, gRPC metrics, or Database Client Metrics.
How to send OpenTelemetry traces, metrics, and logs to Grafana Tempo, Mimir, and Loki
Grafana Cloud
When using Grafana Cloud, follow the instructions of he Grafana Cloud documentation page OpenTelemetry > Send data to the Grafana Cloud OTLP endpoint.
Self managed Tempo, Mimir, and Loki
Example OpenTelemetry Collector configuration to send to self managed instances of Tempo, Mimir, and Loki:
Replace tempo.example.com , mimir.example.com , and loki.example.com by the desired host names.
For production deployments, enable TLS security and remove insecure: true.
receivers:
  otlp:
    protocols:
      grpc:
        endpoint: 0.0.0.0:4317
      http:
        endpoint: 0.0.0.0:4318
processors:
batch:
exporters:
otlphttp/metrics:
endpoint: http://mimir.example.com:9090/api/v1/otlp
tls:
insecure: true
otlphttp/traces:
endpoint: http://tempo.example.com:4418
tls:
insecure: true
otlphttp/logs:
endpoint: http://loki.example.com:3100/otlp
tls:
insecure: true
debug/metrics:
verbosity: detailed
debug/traces:
verbosity: detailed
debug/logs:
verbosity: detailed
service:
pipelines:
traces:
receivers: [otlp]
processors: [batch]
exporters: [otlphttp/traces]
#exporters: [otlphttp/traces,debug/traces]
metrics:
receivers: [otlp]
processors: [batch]
exporters: [otlphttp/metrics]
#exporters: [otlphttp/metrics,debug/metrics]
logs:
receivers: [otlp]
processors: [batch]
exporters: [otlphttp/logs]
#exporters: [otlphttp/logs,debug/logs]
The drop down list for services is empty
TODO
Support
Please report issues on https://github.com/cyrille-leclerc/opentelemetry-service-dashboard.
License
Apache-2.0 license.
Data source config
Collector config:
Upload an updated version of an exported dashboard.json file from Grafana
| Revision | Description | Created | |
|---|---|---|---|
| Download |