Fuel Mainnet Node Monitoring by Cumulo
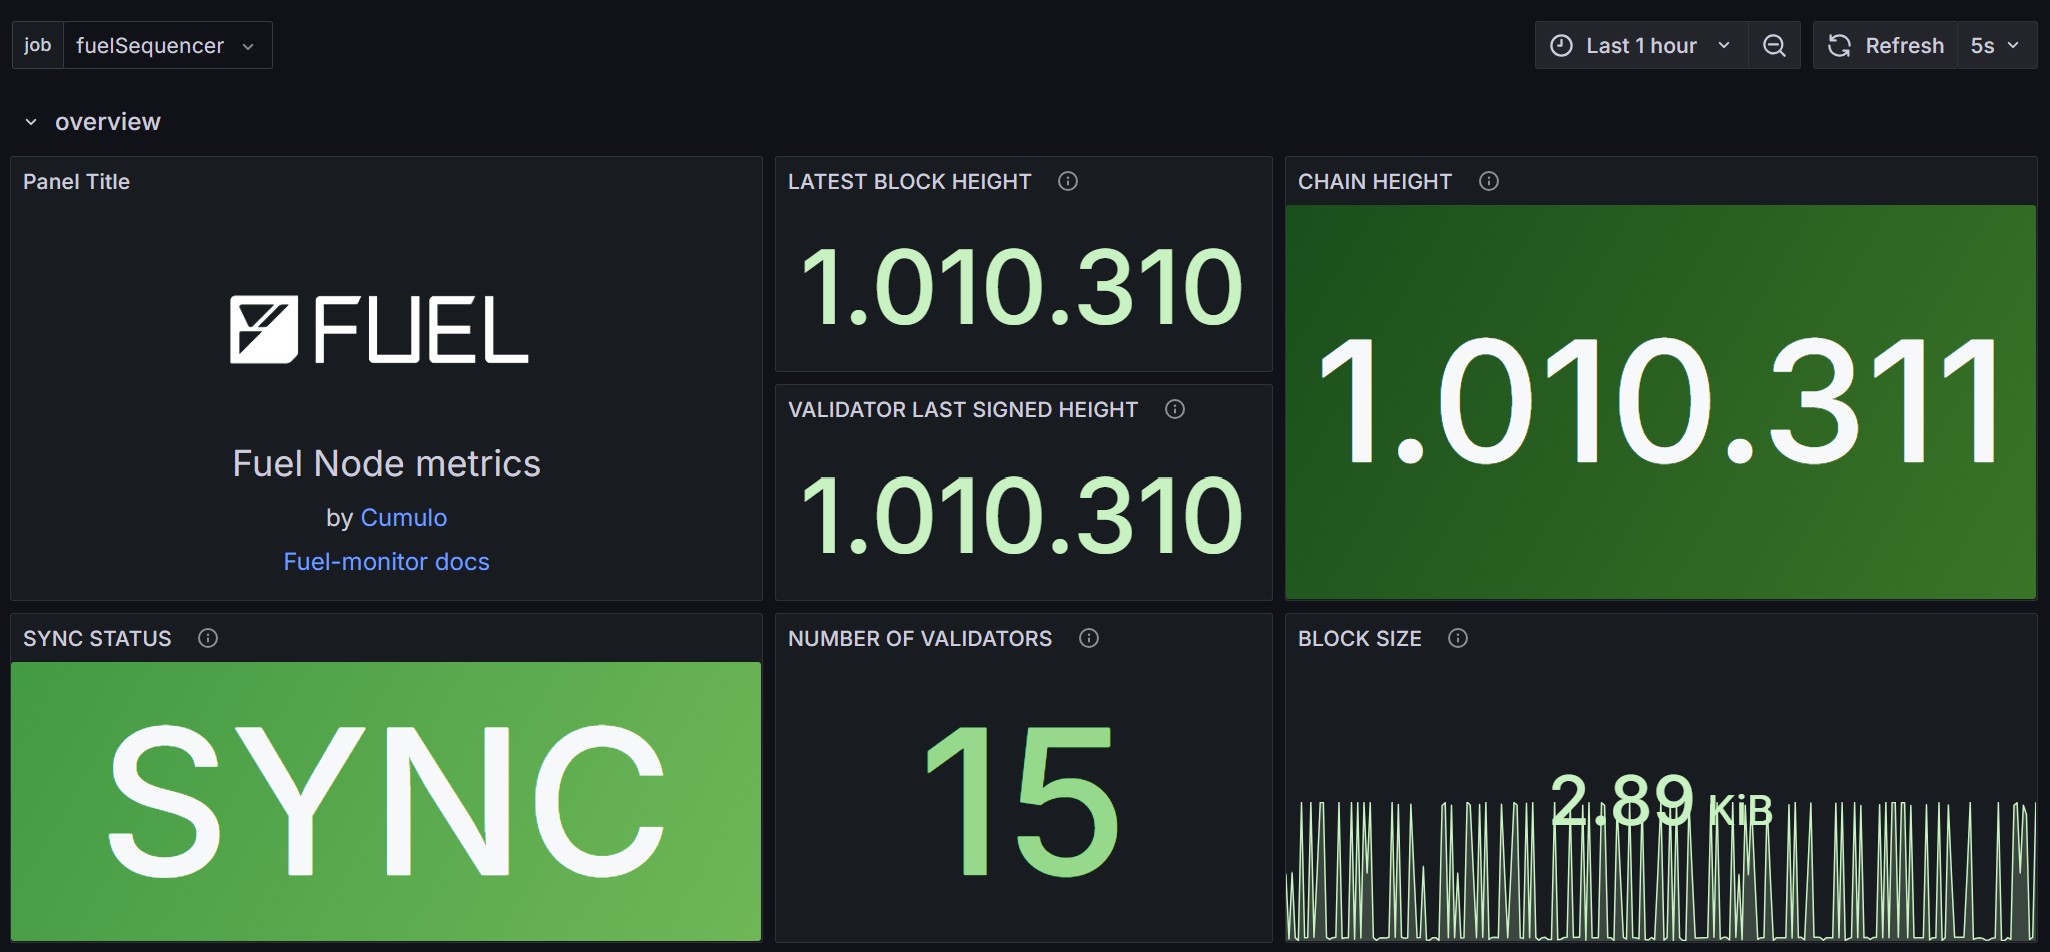
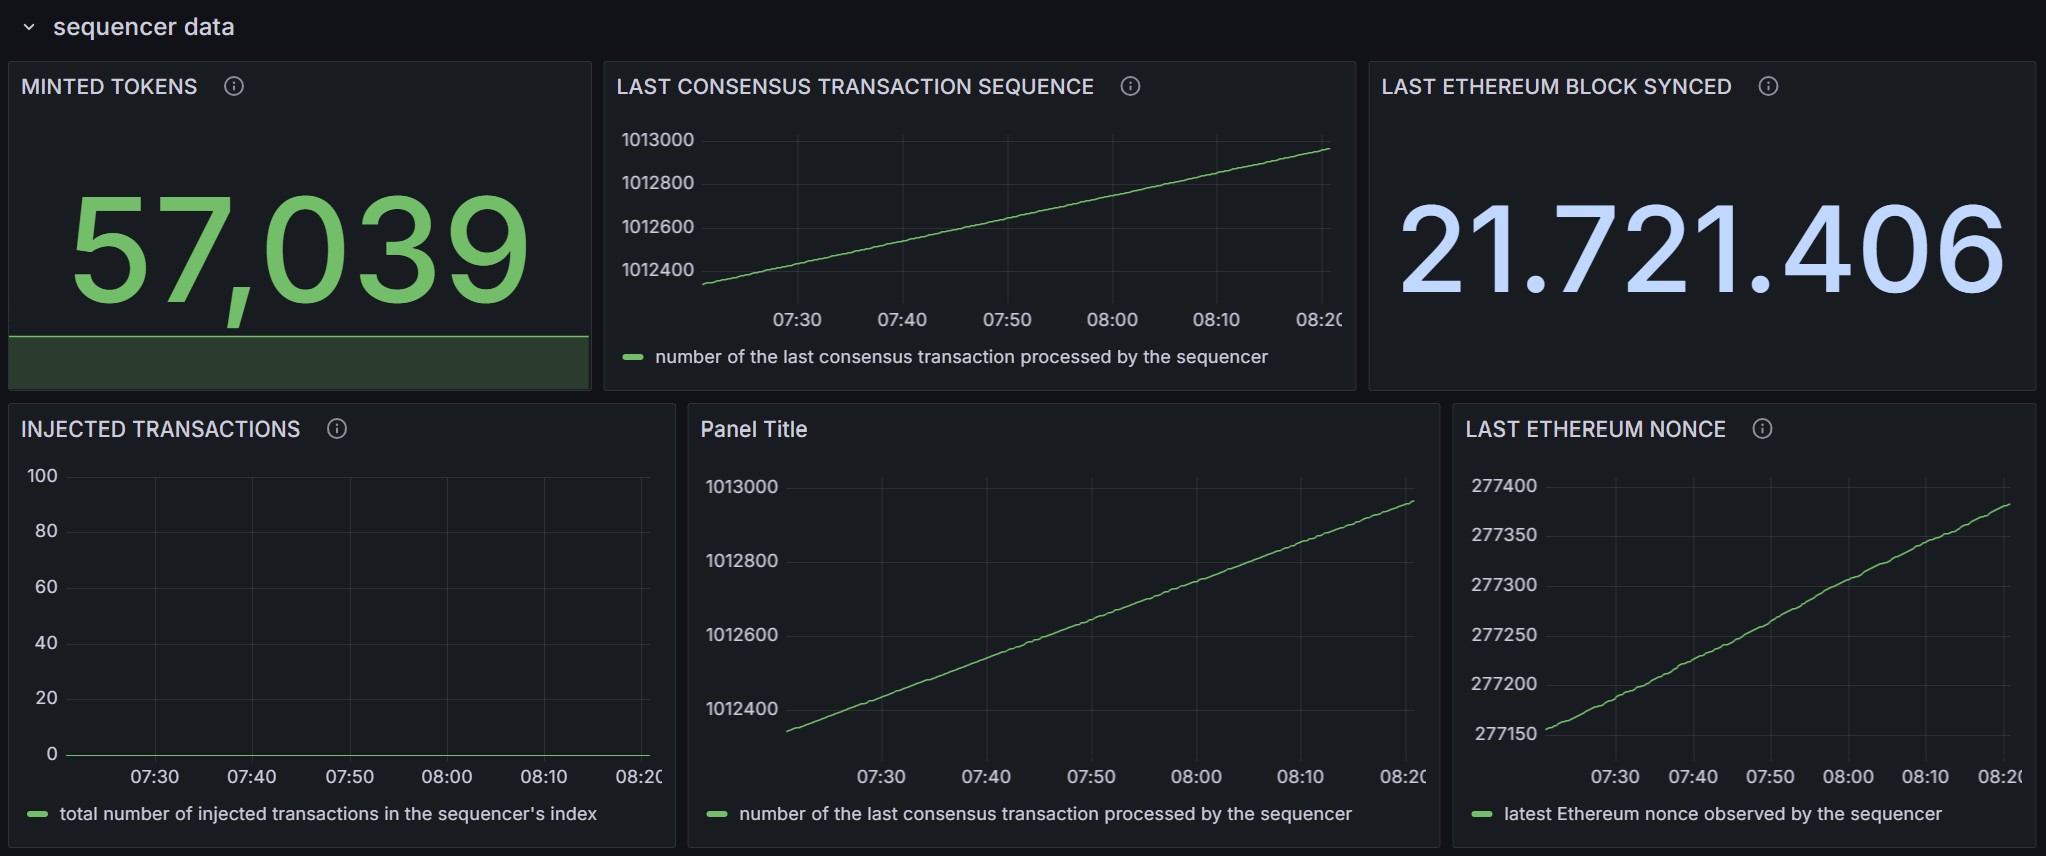
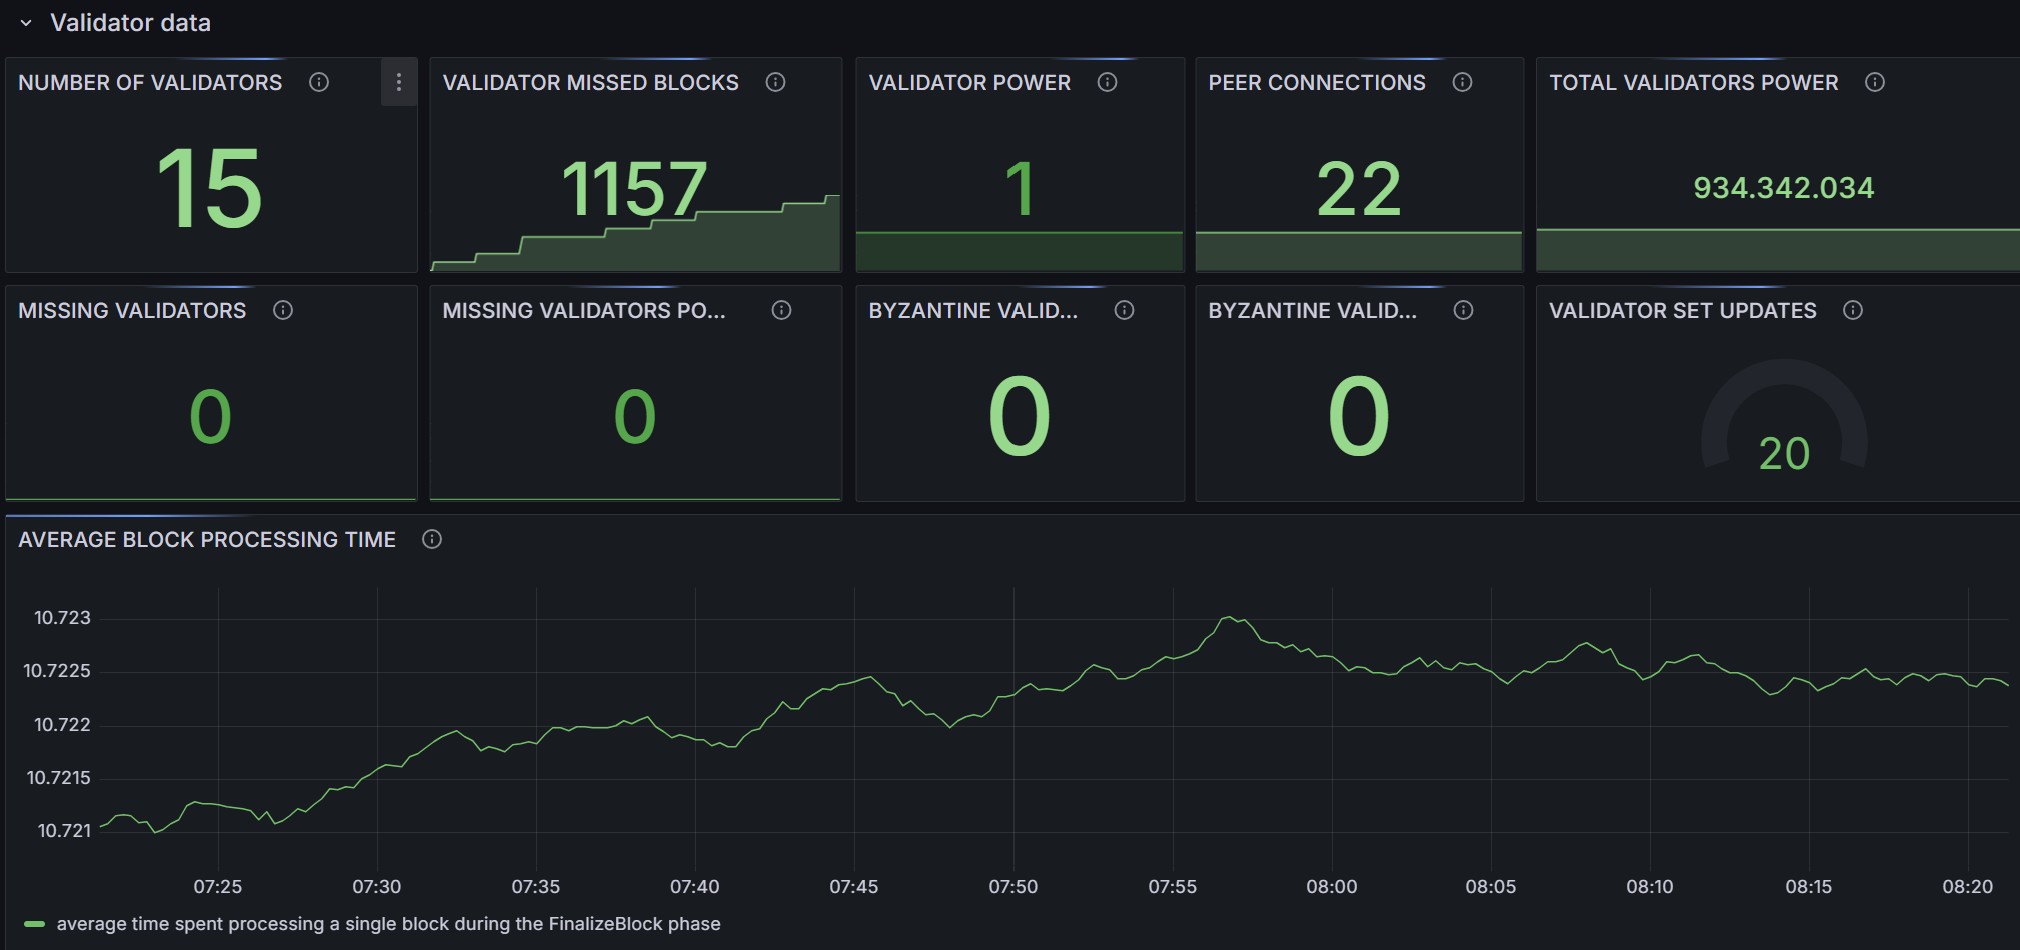
This version of the Grafana dashboard is specifically designed for monitoring Fuel nodes on the mainnet. It includes comprehensive configurations and visualizations tailored to provide real-time insights into the performance and health of your Fuel node. By integrating Grafana with Node Exporter, this setup enables you to track critical metrics, such as Ethereum transaction status, system resource usage, and time-sensitive updates, through interactive panels and informative graphs. With this custom monitoring solution, managing and optimizing your Fuel mainnet nodes becomes seamless and efficient.
Data source config
Collector config:
Upload an updated version of an exported dashboard.json file from Grafana
| Revision | Description | Created | |
|---|---|---|---|
| Download |
Linux Server
Monitor Linux with Grafana. Easily monitor your Linux deployment with Grafana Cloud's out-of-the-box monitoring solution.
Learn more