Fail2ban
Dashboard to have a Overview of the Fail2Ban logs collected via Promtail/Loki
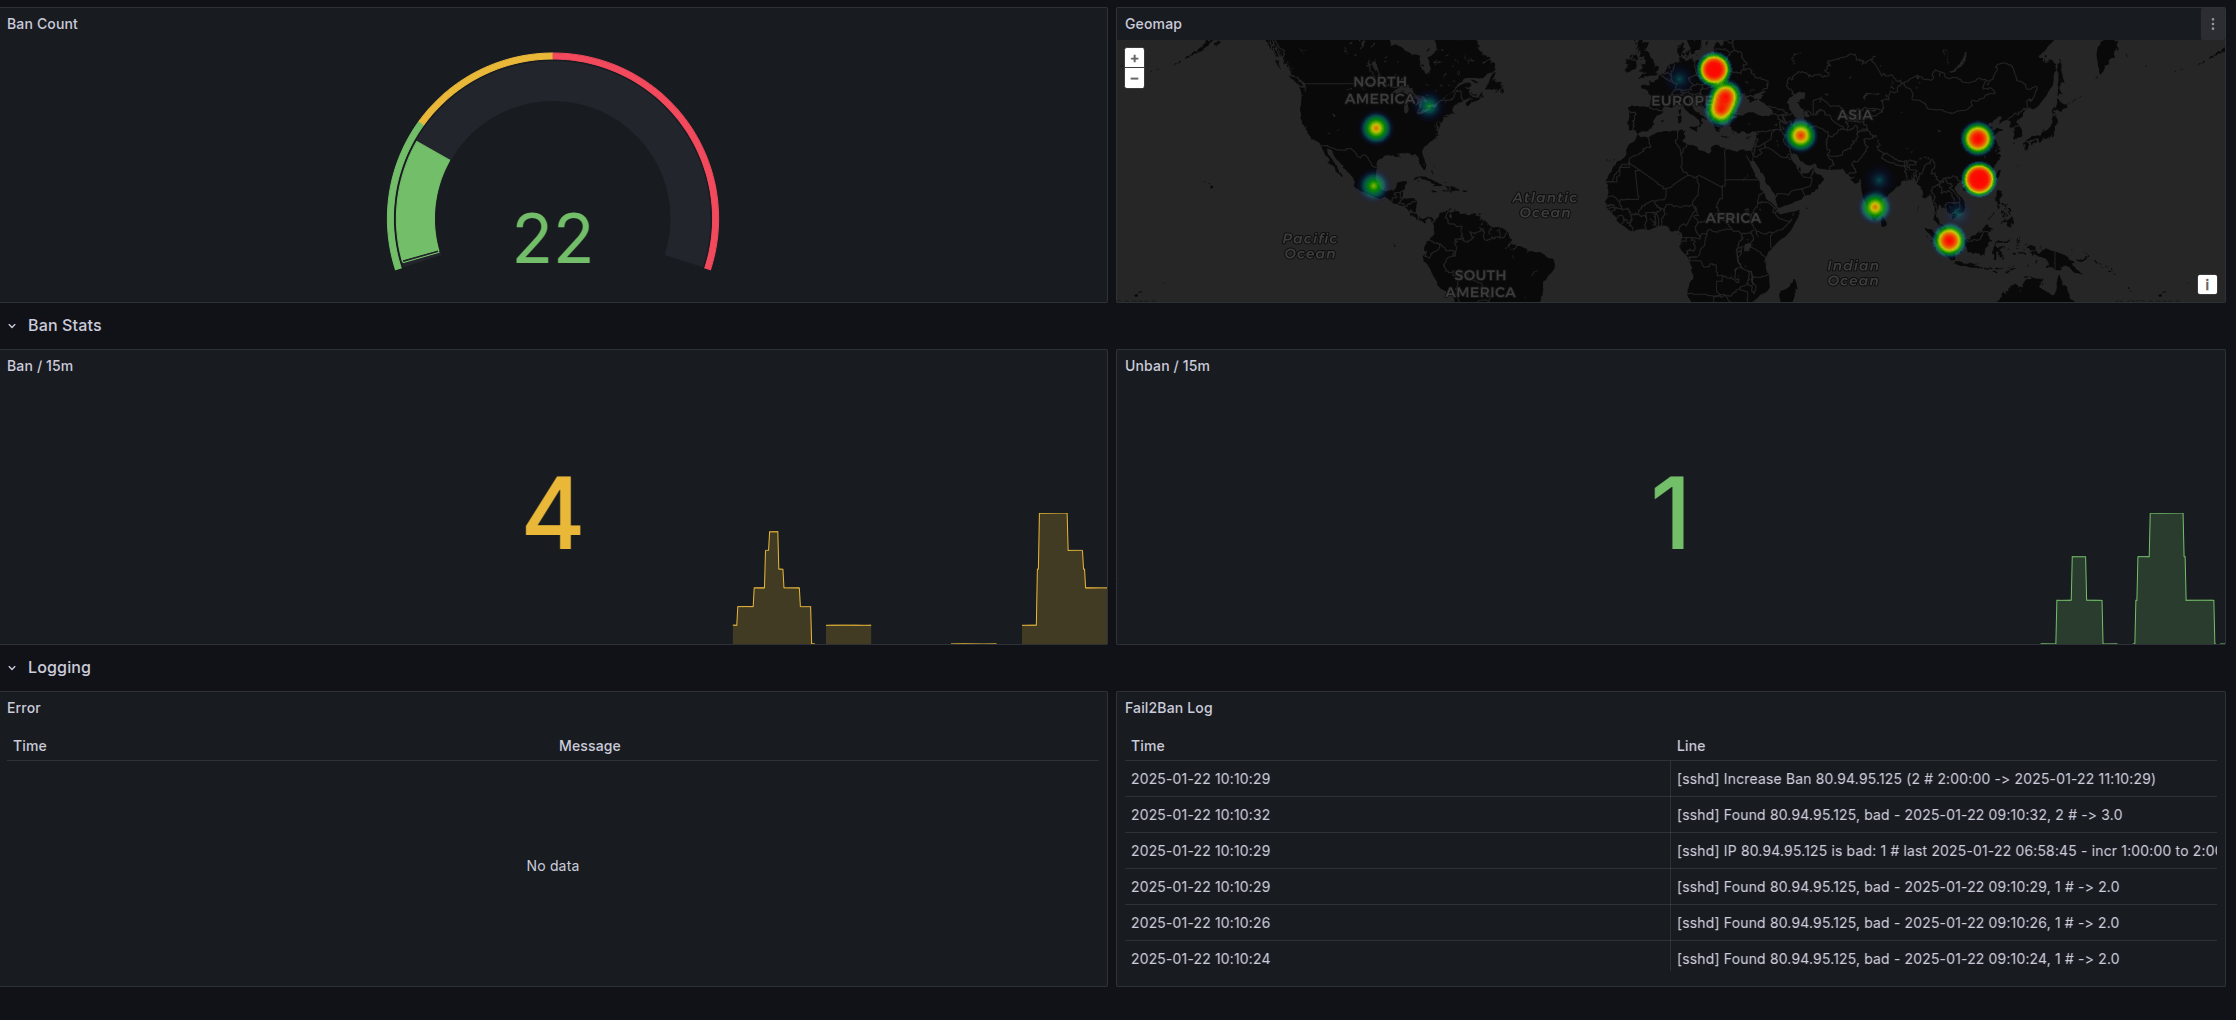
This is my try to create a Dashboard that visualize the Logs of Fail2Ban. It integrates with the GeoLite Database to display a Heatmap.
Since promtail got deprecated here is my Alloy Config:
// Get the fail2ban log and integrate GeoIP
local.file_match "fail2ban" {
        path_targets = [{
                __address__ = "localhost",
                __path__    = "/var/log/fail2ban.log",
                job         = "fail2ban",
        }]
}
loki.process "fail2ban" {
        forward_to = [loki.write.loki.receiver]
    stage.multiline {
            firstline     = "\\d{4}-\\d{2}-\\d{2} \\d{2}:\\d{2}:\\d{2}"
            max_wait_time = "10s"
    }

    stage.regex {
            expression = "^(?s)(?P<time>\\S+? \\S+?) (fail2ban\\.)(?P<component>\\S+)\\s* \\[(?P<pid>\\S+)\\]: (?P<priority>\\S+)\\s* (?P<message>.*?)$"
    }

    stage.timestamp {
            source = "time"
            format = "2006-01-02 15:04:05,000"
    }

    stage.labels {
            values = {
                    component = null,
                    priority  = null,
            }
    }

    stage.output {
            source = "message"
    }
stage.match {
            selector = "{job=\"fail2ban\"} |~ \"\\\\\\\\[\\\\\\\\S+\\\\\\\\] .*\""

            stage.regex {
                    expression = "(\\[(?P<jail>\\S+)\\] )?(?P<message>.*?)$"
            }

            stage.labels {
                    values = {
                            jail = null,
                    }
            }

            stage.output {
                    source = "message"
            }
    }

    stage.regex {
            expression = ".*?(?P<remote_addr>\\d+\\.\\d+\\.\\d+\\.\\d+).*"
    }

    stage.geoip {
            db      = "/GeoLite2-City.mmdb"
            source  = "remote_addr"
            db_type = "city"
    }
stage.labels {
        values = {
            geoip_city_name          = "",
            geoip_country_name       = "",
            geoip_country_code       = "",
            geoip_continent_name     = "",
            geoip_continent_code     = "",
            geoip_location_latitude  = "",
            geoip_location_longitude = "",
            geoip_postal_code        = "",
            geoip_timezone           = "",
            geoip_subdivision_name   = "",
            geoip_subdivision_code   = "",
        }
    }

    stage.label_drop {
            values = ["filename"]
    }
}
loki.source.file "fail2ban" {
targets = local.file_match.fail2ban.targets
forward_to = [loki.process.fail2ban.receiver]
}
loki.write "loki" {
endpoint {
url = string.format(
"http://%s/loki/api/v1/push",
coalesce(sys.env("LOKI_HOST"), "loki:3100"),
)
}
}
I will also post my promtail config:
- job_name: fail2ban
  static_configs:
    - targets:
        - localhost
      labels:
        job: fail2ban
        __path__: /var/log/fail2ban.log
  pipeline_stages:
    - multiline:
        firstline: '\d{4}-\d{2}-\d{2} \d{2}:\d{2}:\d{2}'
    - regex:
        expression: >-
          ^(?s)(?P<time>\S+? \S+?)
          (fail2ban\.)(?P<component>\S+)\s*
          \[(?P<pid>\S+)\]:
          (?P<priority>\S+)\s*
          (?P<message>.*?)$
    - timestamp:
        source: time
        format: '2006-01-02 15:04:05,000'
    - labels:
        component:
        priority:
    - output:
        source: message
    - match:
        selector: '{job="fail2ban"} |~ "\\\\[\\\\S+\\\\] .*"'
        stages:
          - regex:
              expression: '(\[(?P<jail>\S+)\] )?(?P<message>.*?)$'
          - labels:
              jail:
          - output:
              source: message
    - regex:
        expression: '.*?(?P<remote_addr>\d+\.\d+\.\d+\.\d+).*'
    - geoip:
        db: /GeoLite2-City.mmdb
        source: remote_addr
        db_type: city
    - labeldrop:
        - filename
Data source config
Collector type:
Collector plugins:
Collector config:
Revisions
Upload an updated version of an exported dashboard.json file from Grafana
| Revision | Description | Created | |
|---|---|---|---|
| Download |