Mattermost Desktop App Metrics
This dashboard displays performance metrics reported by the Mattermost Desktop App. Converse to the Web App Metrics dashboard, this one focuses on hardware usage by showing CPU and memory usage, broken down by individual process created by the Mattermost Desktop App. The dashboard allows filtering by Mattermost Desktop App version and operating system.
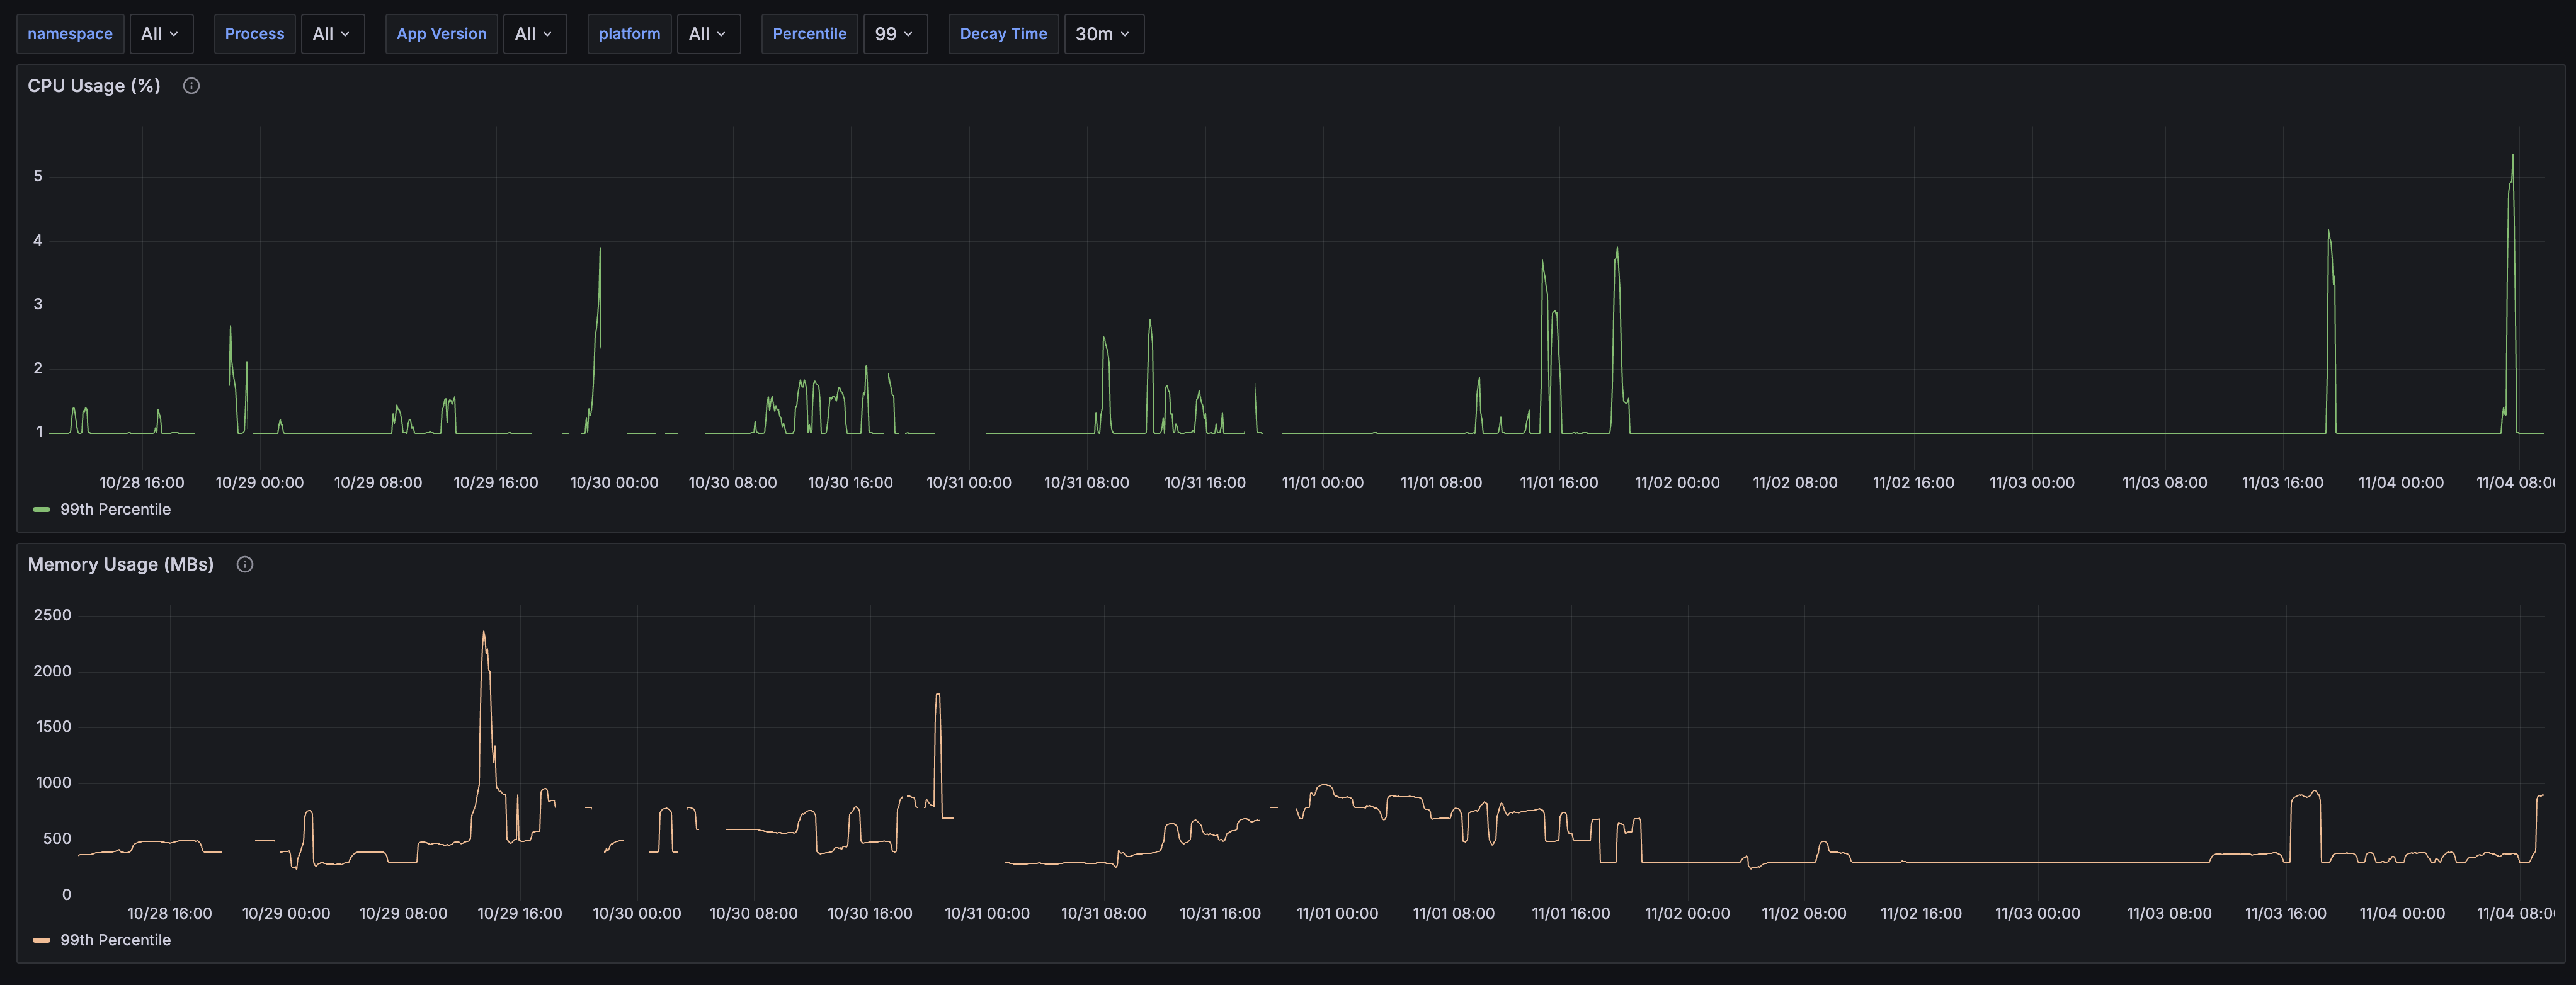
The Mattermost Desktop App Metrics dashboard uses the prometheus data source to create a Grafana dashboard with the timeseries panel.
Data source config
Collector type:
Collector plugins:
Collector config:
Revisions
Upload an updated version of an exported dashboard.json file from Grafana
| Revision | Description | Created | |
|---|---|---|---|
| Download |
Docker Desktop
Monitor Docker Desktop with Grafana. Easily keep tabs on your containers with Grafana Cloud's out-of-the-box monitoring solution.
Learn more