Checkly Dashboard for Prometheus v2
Display your data from Checkly's Prometheus v2 integration
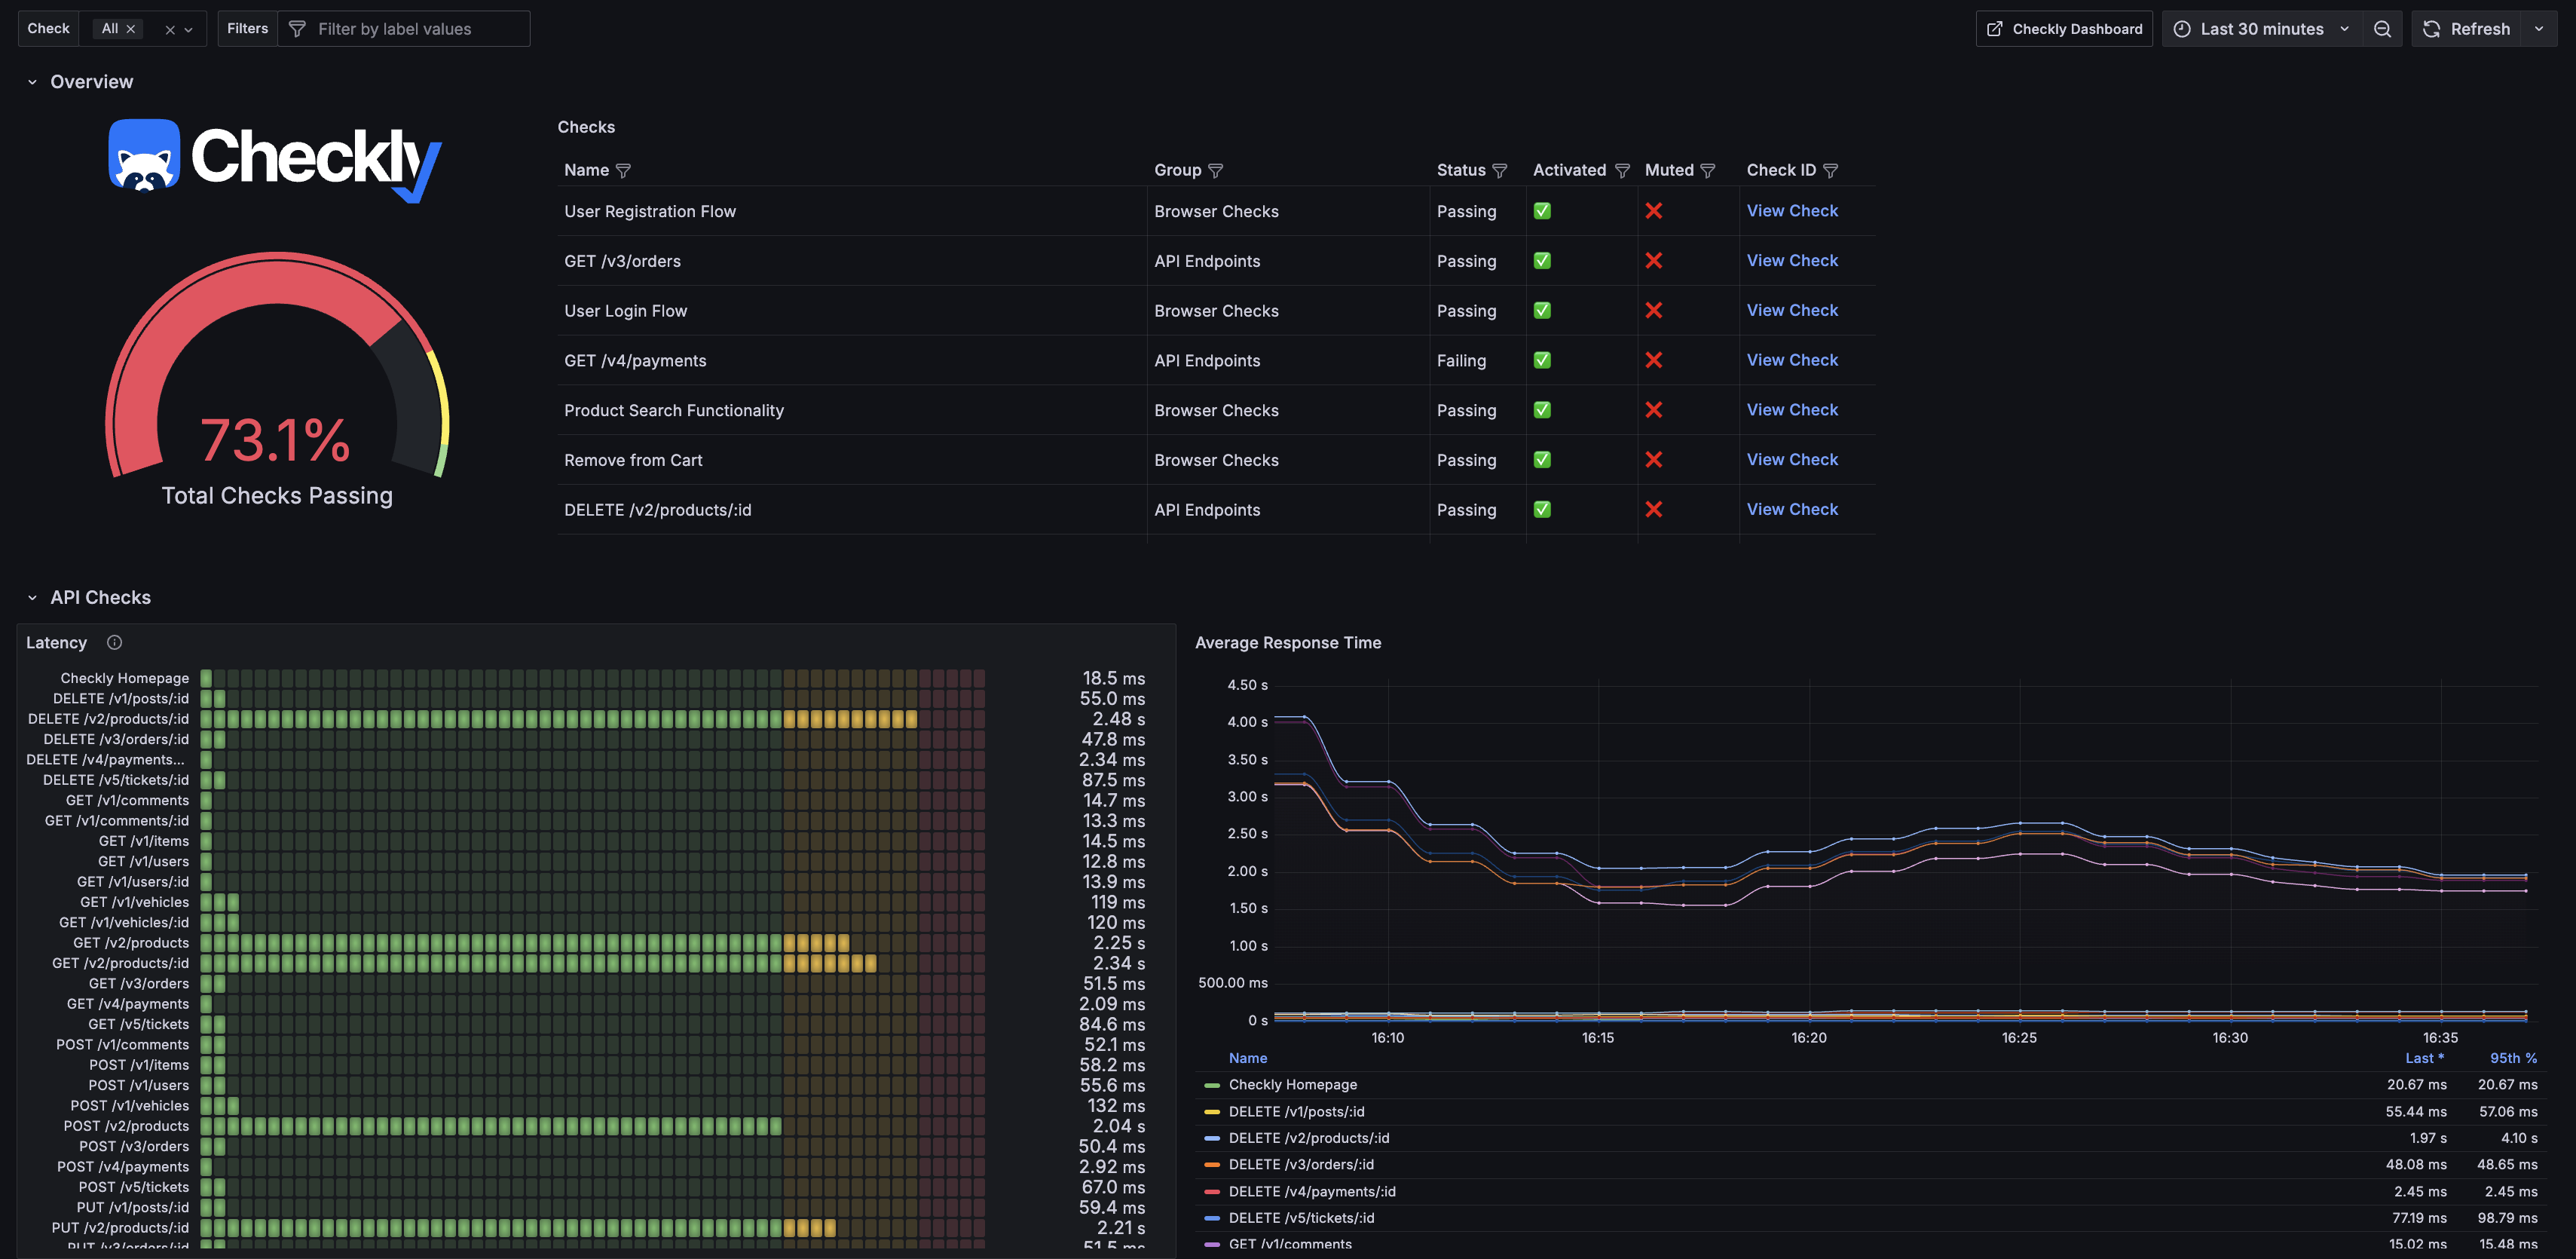
Official Checkly Grafana Dashboard for Prometheus V2
This dashboard leverages the enhanced capabilities of Checkly's v2 Prometheus integration to provide a view of your Checkly monitoring data.
Getting Started
To use this dashboard, ensure that Checkly’s v2 Prometheus integration is activated in your environment. For detailed setup instructions, visit Checkly's Prometheus Integration Docs. Once the integration is configured, input this dashboard's ID (22728) into your Grafana instance under “Dashboards” -> “Manage” -> “Import”.
This official dashboard provides an excellent foundation to monitor your Checkly data efficiently. You can customize it further to suit your specific use case!
Data source config
Collector config:
Upload an updated version of an exported dashboard.json file from Grafana
| Revision | Description | Created | |
|---|---|---|---|
| Download |
Metrics Endpoint (Prometheus)
Easily monitor any Prometheus-compatible and publicly accessible metrics URL with Grafana Cloud's out-of-the-box monitoring solution.
Learn more