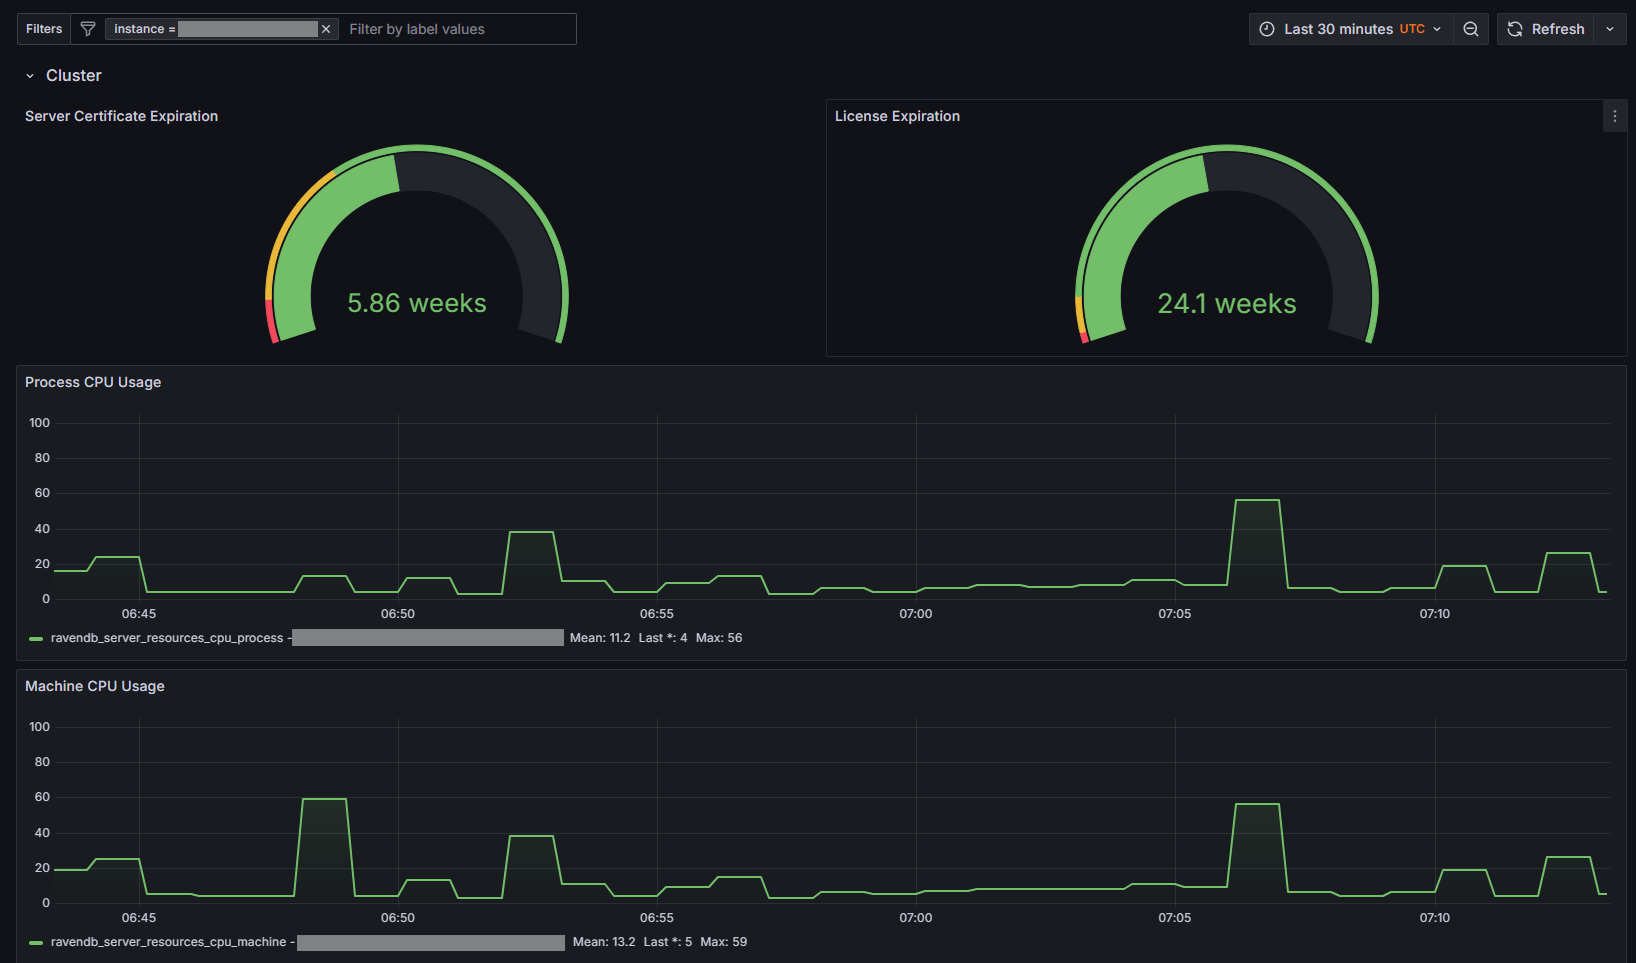
RavenDB - Prometheus
RavenDB monitoring template for Prometheus
RavenDB website: https://ravendb.net
You can use Open Telemetry to send data to Prometheus: https://ravendb.net/docs/article-page/6.2/csharp/server/administration/monitoring/open-telemetry#opentelemetry-support
Data source config
Collector type:
Collector plugins:
Collector config:
Revisions
Upload an updated version of an exported dashboard.json file from Grafana
| Revision | Description | Created | |
|---|---|---|---|
| Download |
Metrics Endpoint (Prometheus)
Easily monitor any Prometheus-compatible and publicly accessible metrics URL with Grafana Cloud's out-of-the-box monitoring solution.
Learn more