Ktranslate Flow Summary
Designed to visualize flow data coming in from Kentik's Ktranslate open source flow collector.
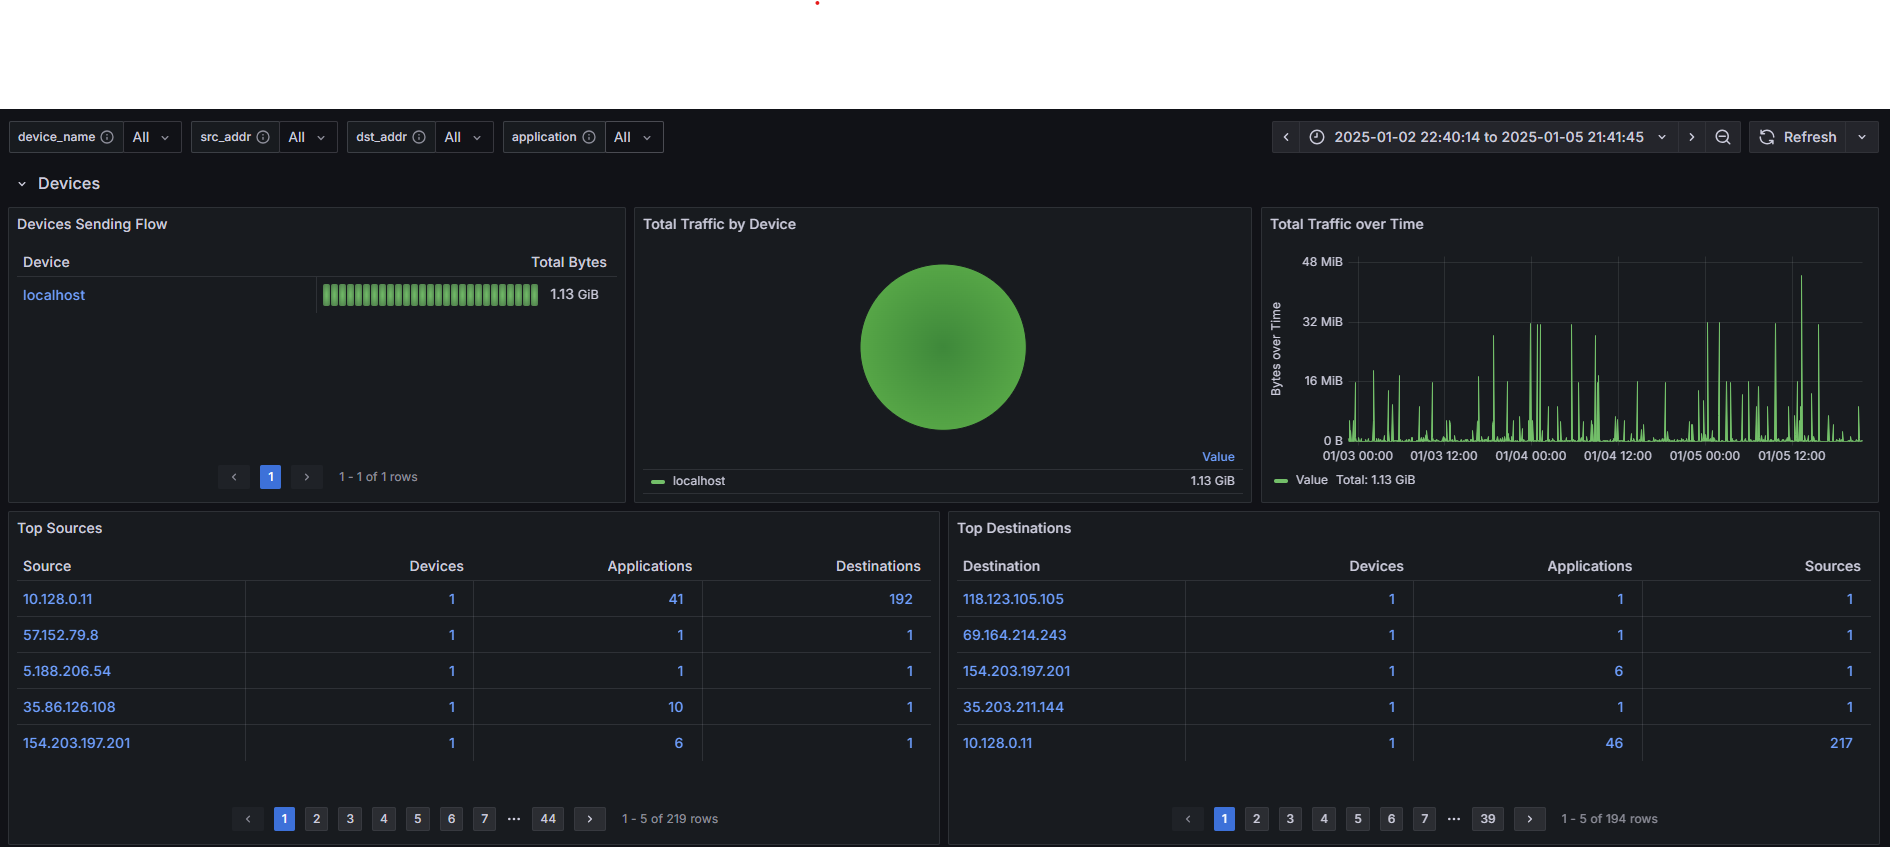
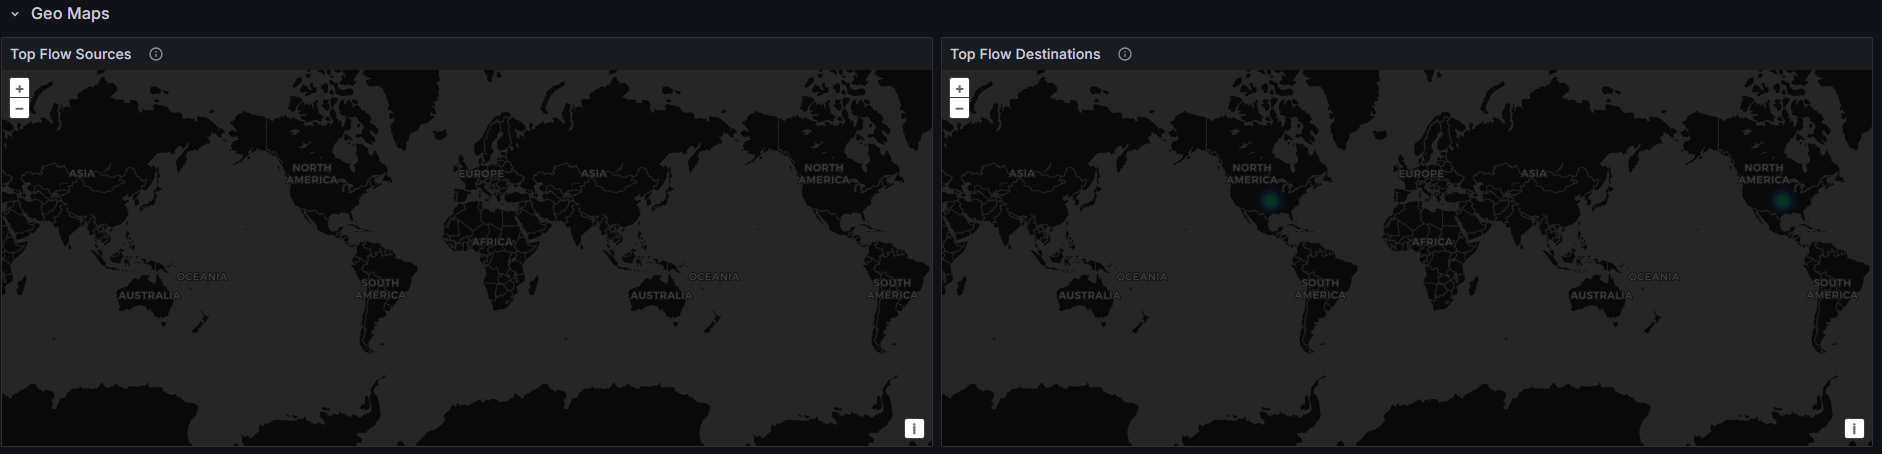
Ktranslate ingests incoming flow from most types of network devices, performs aggregations, filtering, sampling, etc and then converts it to a variety of back end protocols. In this case we are using the OTel sink to send to Grafana Cloud. I don't believe the dashboard would need many/any changes if you chose to use the Prometheus sink.
See this repo for an easy example for how to deploy Ktranslate with Docker compose to connect it to Grafana. https://github.com/Mesverrum/KtransToGrafana/tree/main
Kentik's Ktranslate repo https://github.com/kentik/ktranslate
Data source config
Collector type:
Collector plugins:
Collector config:
Revisions
Upload an updated version of an exported dashboard.json file from Grafana
| Revision | Description | Created | |
|---|---|---|---|
| Download |